4,005
Views
127
CrossRef citations to date
0
Altmetric
Basic Research Paper

Hepatitis B virus X protein inhibits autophagic degradation by impairing lysosomal maturation

, , , , , , , , , & show all
Pages 416-430 | Received 27 May 2013, Accepted 20 Nov 2013, Published online: 23 Dec 2013

Figures & data

Figure 1. HBx induces accumulation of autophagosomes. (A) Huh7 cells were transfected with HBV genomic DNA (HBV) or HBx-negative HBV genomic DNA (HBVX). At 48 h after transfection, the cells were stained with HBcAg and LC3 antibodies, and were imaged by confocal microscopy. Scale bars: 20 µm. (B) Statistical analysis of the number of LC3-dots per cell in cells with or without expression of HBV or HBVX in the presence or absence of chloroquine (CQ) or bafilomycin A1 (Baf A1). Data are presented as mean ± SEM, n = 50. (C) L02 and Huh7 cells were transfected with GFP or HBx-GFP. At 48 h after transfection, the cells were immunostained with LC3 antibody and were imaged. Only the images from L02 cells were shown. Scale bars: 20 µm. (D) Statistical analysis of the number of LC3-dots per cell in cells expressing GFP or HBx-GFP. Only GFP- or HBx-GFP-positive cells were counted. Data are presented as mean ± SEM, n = 50. (E) L02 and Huh7 cells were either starved or transfected with GFP or HBx-GFP for 48 h, then the cellular LC3 levels were assessed by western blot. (F) Autophagic vacuoles in cells expressing GFP (control) or HBx-GFP were observed by electron microscopy. The arrow indicates autophagic vacuoles. Scale bars: 0.5 µm. The graph shows a statistical analysis of cytoplasmic occupancy of autophagic vacuoles in the cells. Data are presented as mean ± SEM, n = 20. (G) Autophagic vacuoles were isolated from liver tissues from control individuals and HBV-associated HCC individuals. Then HBx, LC3 and LAMP1 levels were analyzed by western blot. Hom, liver homogenates; AV, autophagic vacuoles. ***P < 0.001.
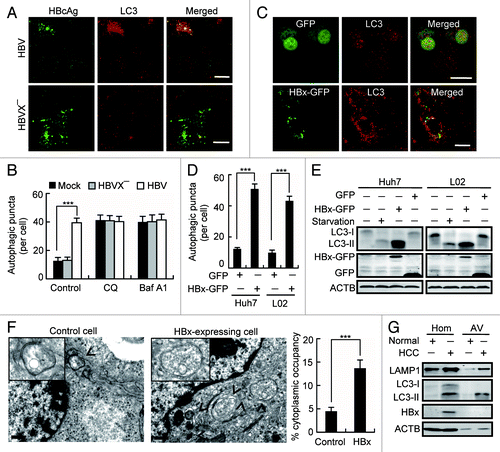
Figure 1. HBx induces accumulation of autophagosomes. (A) Huh7 cells were transfected with HBV genomic DNA (HBV) or HBx-negative HBV genomic DNA (HBVX−). At 48 h after transfection, the cells were stained with HBcAg and LC3 antibodies, and were imaged by confocal microscopy. Scale bars: 20 µm. (B) Statistical analysis of the number of LC3-dots per cell in cells with or without expression of HBV or HBVX− in the presence or absence of chloroquine (CQ) or bafilomycin A1 (Baf A1). Data are presented as mean ± SEM, n = 50. (C) L02 and Huh7 cells were transfected with GFP or HBx-GFP. At 48 h after transfection, the cells were immunostained with LC3 antibody and were imaged. Only the images from L02 cells were shown. Scale bars: 20 µm. (D) Statistical analysis of the number of LC3-dots per cell in cells expressing GFP or HBx-GFP. Only GFP- or HBx-GFP-positive cells were counted. Data are presented as mean ± SEM, n = 50. (E) L02 and Huh7 cells were either starved or transfected with GFP or HBx-GFP for 48 h, then the cellular LC3 levels were assessed by western blot. (F) Autophagic vacuoles in cells expressing GFP (control) or HBx-GFP were observed by electron microscopy. The arrow indicates autophagic vacuoles. Scale bars: 0.5 µm. The graph shows a statistical analysis of cytoplasmic occupancy of autophagic vacuoles in the cells. Data are presented as mean ± SEM, n = 20. (G) Autophagic vacuoles were isolated from liver tissues from control individuals and HBV-associated HCC individuals. Then HBx, LC3 and LAMP1 levels were analyzed by western blot. Hom, liver homogenates; AV, autophagic vacuoles. ***P < 0.001.

Figure 2. Characterization of HBx-triggered autophagosome accumulation. (A) Huh7 cells were treated with rapamycin or transfected with GFP or HBx-GFP for 48 h. Phosphorylation of MTOR and RPS6KB was analyzed by western blot using specific anti-phospho-MTOR or anti-phospho-RPS6KB antibodies. (B) Huh7 cells with or without HBx-GFP expression for 48 h were either starved or treated with rapamycin. Then the cells were fixed and stained with LC3 antibody. The number of LC3-dots per cell was quantified and is presented as mean ± SEM, n = 50. **P < 0.01. GFP-expressing cells were used as a control for HBx-GFP-expressing cells. (C) Western blot analysis of LC3 in cells treated as in (B).
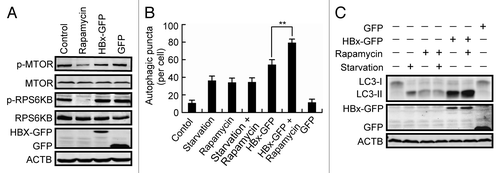
Figure 2. Characterization of HBx-triggered autophagosome accumulation. (A) Huh7 cells were treated with rapamycin or transfected with GFP or HBx-GFP for 48 h. Phosphorylation of MTOR and RPS6KB was analyzed by western blot using specific anti-phospho-MTOR or anti-phospho-RPS6KB antibodies. (B) Huh7 cells with or without HBx-GFP expression for 48 h were either starved or treated with rapamycin. Then the cells were fixed and stained with LC3 antibody. The number of LC3-dots per cell was quantified and is presented as mean ± SEM, n = 50. **P < 0.01. GFP-expressing cells were used as a control for HBx-GFP-expressing cells. (C) Western blot analysis of LC3 in cells treated as in (B).

Figure 3. HBx inhibits autophagic degradation. (A) Pseudocolor-coded images showing LC3 intensity in Huh7 cells expression of GFP, HBx-GFP, HBV, or HBVX. (B) Quantification of the relative mean LC3 intensity per cell in cells expression of GFP, HBx-GFP, HBV, or HBVX, n = 30. (C) L02 cells stably expressing GFP-LC3 were either starved or treated with 100 nM bafilomycin A1 (Baf A1) for 12 h or transfected with HBx-HA for 48 h. Then the cells were analyzed by western blot using anti-GFP antibody. Note the production of GFP fragment. (D) Huh7 cells transfected with HBV or HBVX were fixed and stained with HBcAg and SQSTM1 antibodies at 48 h post-transfection. Quantification shown on the right represents the relative fluorescence intensity of SQSTM1 in cells expressing HBV or HBVX in the presence or absence of 50 µM chloroquine (CQ), n = 30. (E) Huh7 cells with GFP or HBx-GFP expression were treated with 100 nM Baf A1 for 12 h. The cellular SQSTM1 level was analyzed by western blot. Quantification shown on the right represents the relative SQSTM1 levels of the cells normalized to ACTB, and the fold change vs. GFP-expressing control cells was quantified from 3 independent experiments. All the quantitative data are presented as mean ± SEM ***P < 0.001. Scale bars: 20 µm.
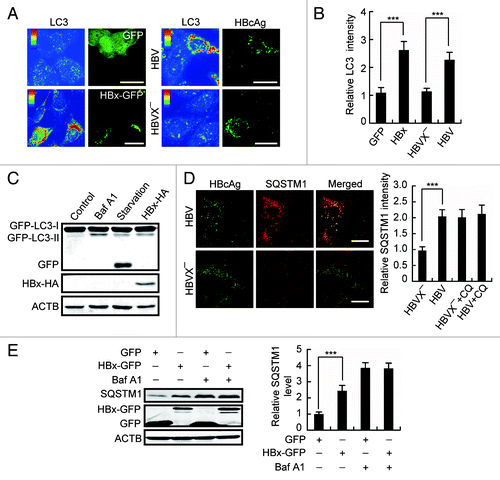
Figure 3. HBx inhibits autophagic degradation. (A) Pseudocolor-coded images showing LC3 intensity in Huh7 cells expression of GFP, HBx-GFP, HBV, or HBVX−. (B) Quantification of the relative mean LC3 intensity per cell in cells expression of GFP, HBx-GFP, HBV, or HBVX−, n = 30. (C) L02 cells stably expressing GFP-LC3 were either starved or treated with 100 nM bafilomycin A1 (Baf A1) for 12 h or transfected with HBx-HA for 48 h. Then the cells were analyzed by western blot using anti-GFP antibody. Note the production of GFP fragment. (D) Huh7 cells transfected with HBV or HBVX− were fixed and stained with HBcAg and SQSTM1 antibodies at 48 h post-transfection. Quantification shown on the right represents the relative fluorescence intensity of SQSTM1 in cells expressing HBV or HBVX− in the presence or absence of 50 µM chloroquine (CQ), n = 30. (E) Huh7 cells with GFP or HBx-GFP expression were treated with 100 nM Baf A1 for 12 h. The cellular SQSTM1 level was analyzed by western blot. Quantification shown on the right represents the relative SQSTM1 levels of the cells normalized to ACTB, and the fold change vs. GFP-expressing control cells was quantified from 3 independent experiments. All the quantitative data are presented as mean ± SEM ***P < 0.001. Scale bars: 20 µm.

Figure 4. HBx does not affect autophagosome-lysosome fusion. (A) L02 cells expressing RAB7A-GFP were either starved or cotransfected with HBx-Cherry or Cherry. Then the cells were fixed, stained with anti-LC3 antibody and imaged by confocal microscopy. (B) Statistical analysis of the colocalization coefficient of RAB7A-GFP and LC3. The colocalization coefficient was represented as percentage of punctate signals of LC3 that were positive for RAB7A-GFP. (C) Colocalization of endogenous LC3 and LAMP1 in starved L02 cells with or without RAB7AT22N-GFP expression, or in HBx-GFP-expressing L02 cells. RAB7AT22N-GFP-expressing cells were used as a negative control. (D) Statistical analysis of the colocalization coefficient of LC3 and LAMP1. The colocalization coefficient was represented as percentage of punctate signals of LC3 that were positive for LAMP1. (E) Huh7 cells expression of Cherry-LC3 were either starved or cotransfected with HBV genome DNA for 48 h. Then the cells were fixed, stained with HBcAg and LAMP1 antibodies, and were imaged. (F) Statistical analysis of the colocalization coefficient of Cherry-LC3 and LAMP1. The colocalization coefficient was represented as percentage of punctate signals of Cherry-LC3 that were positive for LAMP1. Quantifications were performed using Velocity software, and the values represent mean ± SEM of 30 cells. **P < 0.01. Scale bars: 5 µm.
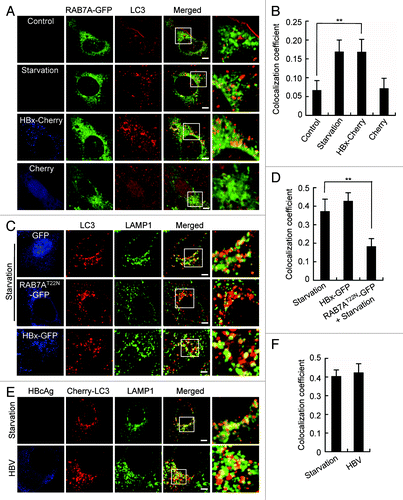
Figure 4. HBx does not affect autophagosome-lysosome fusion. (A) L02 cells expressing RAB7A-GFP were either starved or cotransfected with HBx-Cherry or Cherry. Then the cells were fixed, stained with anti-LC3 antibody and imaged by confocal microscopy. (B) Statistical analysis of the colocalization coefficient of RAB7A-GFP and LC3. The colocalization coefficient was represented as percentage of punctate signals of LC3 that were positive for RAB7A-GFP. (C) Colocalization of endogenous LC3 and LAMP1 in starved L02 cells with or without RAB7AT22N-GFP expression, or in HBx-GFP-expressing L02 cells. RAB7AT22N-GFP-expressing cells were used as a negative control. (D) Statistical analysis of the colocalization coefficient of LC3 and LAMP1. The colocalization coefficient was represented as percentage of punctate signals of LC3 that were positive for LAMP1. (E) Huh7 cells expression of Cherry-LC3 were either starved or cotransfected with HBV genome DNA for 48 h. Then the cells were fixed, stained with HBcAg and LAMP1 antibodies, and were imaged. (F) Statistical analysis of the colocalization coefficient of Cherry-LC3 and LAMP1. The colocalization coefficient was represented as percentage of punctate signals of Cherry-LC3 that were positive for LAMP1. Quantifications were performed using Velocity software, and the values represent mean ± SEM of 30 cells. **P < 0.01. Scale bars: 5 µm.

Figure 5. HBx impairs lysosomal degradative capacity. (A) Huh7 cells expressing GFP or HBx-GFP were incubated with 100 ng/ml of EGF for 15 min, then the EGF was washed out. At indicated time points after EGF stimulation, the cells were fixed and immunostained with EGFR antibody. Note the accumulation and subsequent degradation of EGFR puncta. (B) Quantification of the mean EGFR intensity per cell in cells expression of GFP or HBx-GFP. The values were normalized against the intensity in cells 1 h after EGF treatment. Data are presented as mean ± SEM, n = 30. **P < 0.01. (C) Western blot analysis of EGFR at indicated time points after EGF incubation in GFP or HBx-GFP expression cells with or without 100 nM bafilomycin A1 (Baf A1) treatment for 12 h. (D) Huh7 cells were cotransfected with Cherry-LC3 and GFP or Cherry-LC3 and HBx-GFP. At 48 h after transfection, the GFP-expressing cells were starved to accumulate autophagosomes. Then 10 mM of 3-methyladenine (3-MA) was added to the GFP- or HBx-GFP-expressing cells to block the formation of new autophagosomes and the degradation of formed Cherry-LC3-positive autophagosomes was observed at indicated time points. (E) Huh7 cells expressing GFP or HBx-GFP were treated as in (D). LC3 levels in the cells were assessed by western blot. Scale bars: 20 µm.
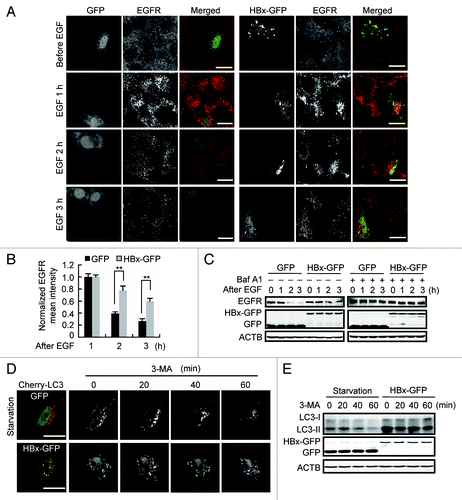
Figure 5. HBx impairs lysosomal degradative capacity. (A) Huh7 cells expressing GFP or HBx-GFP were incubated with 100 ng/ml of EGF for 15 min, then the EGF was washed out. At indicated time points after EGF stimulation, the cells were fixed and immunostained with EGFR antibody. Note the accumulation and subsequent degradation of EGFR puncta. (B) Quantification of the mean EGFR intensity per cell in cells expression of GFP or HBx-GFP. The values were normalized against the intensity in cells 1 h after EGF treatment. Data are presented as mean ± SEM, n = 30. **P < 0.01. (C) Western blot analysis of EGFR at indicated time points after EGF incubation in GFP or HBx-GFP expression cells with or without 100 nM bafilomycin A1 (Baf A1) treatment for 12 h. (D) Huh7 cells were cotransfected with Cherry-LC3 and GFP or Cherry-LC3 and HBx-GFP. At 48 h after transfection, the GFP-expressing cells were starved to accumulate autophagosomes. Then 10 mM of 3-methyladenine (3-MA) was added to the GFP- or HBx-GFP-expressing cells to block the formation of new autophagosomes and the degradation of formed Cherry-LC3-positive autophagosomes was observed at indicated time points. (E) Huh7 cells expressing GFP or HBx-GFP were treated as in (D). LC3 levels in the cells were assessed by western blot. Scale bars: 20 µm.

Figure 6. HBx inhibits lysosomal acidification. (A) Live Huh7 cells expressing CFP or HBx-CFP were labeled with 5 µM acridine orange (AO). AO was imaged through a 515/530-nm band-pass filter (green) or a 580-nm long-pass filter (red). Note the decrease of cytoplasmic AO-red dots in HBx-CFP-expressing cells. Cells treated with 100 nM bafilomycin A1 (Baf A1) for 24 h were used as a positive control showing the complete disappearance of AO-red dots from the cytoplasm. (B) Statistical analysis of the number of AO-red dots per cell in cells expressing CFP or HBx-CFP, or treated with Baf A1, n = 30. (C andE) Live Huh7 cells expressing Cherry-GFP-LC3 (C) or Cherry-GFP-SQSTM1 (E) were starved or cotransfected with HBx-CFP for 48 h. Then the cells were imaged by confocal microscopy. (D and F) Statistical analysis of the percentage of punctate Cherry signals that were positive for GFP in (C and E), n = 30. All the quantitative data are presented as mean ± SEM **P < 0.01. Scale bars: 10 µm.
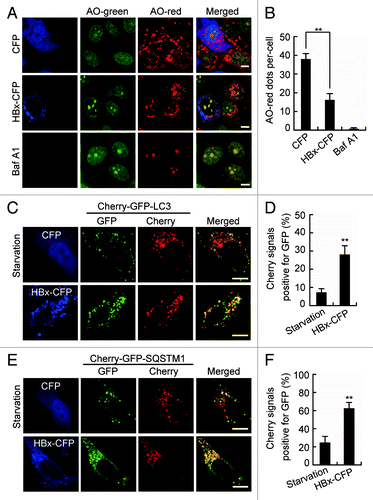
Figure 6. HBx inhibits lysosomal acidification. (A) Live Huh7 cells expressing CFP or HBx-CFP were labeled with 5 µM acridine orange (AO). AO was imaged through a 515/530-nm band-pass filter (green) or a 580-nm long-pass filter (red). Note the decrease of cytoplasmic AO-red dots in HBx-CFP-expressing cells. Cells treated with 100 nM bafilomycin A1 (Baf A1) for 24 h were used as a positive control showing the complete disappearance of AO-red dots from the cytoplasm. (B) Statistical analysis of the number of AO-red dots per cell in cells expressing CFP or HBx-CFP, or treated with Baf A1, n = 30. (C andE) Live Huh7 cells expressing Cherry-GFP-LC3 (C) or Cherry-GFP-SQSTM1 (E) were starved or cotransfected with HBx-CFP for 48 h. Then the cells were imaged by confocal microscopy. (D and F) Statistical analysis of the percentage of punctate Cherry signals that were positive for GFP in (C and E), n = 30. All the quantitative data are presented as mean ± SEM **P < 0.01. Scale bars: 10 µm.

Figure 7. HBx inhibits the maturation of lysosomes. (A and B) Huh7 cells expressing GFP or HBx-GFP for 48 h were analyzed by either immunostaining (A) or western blot (B) using a specific EEA1 antibody. (C) Huh7 cells expressing GFP or HBx-GFP for 48 h were stained with LAMP1 antibody and imaged by confocal microscopy. Quantitation shown on the right represents the number of LAMP1 dots per cell in cells with GFP or HBx-GFP expression, n = 30. (D) Western blot analysis of LAMP1 and LAMP2 levels in Huh7 cells expressing GFP or HBx-GFP for 48 h, quantitation shown on the right represents the relative LAMP1/2 protein levels normalized to ACTB and the data were from 3 independent experiments. (E) Western blot analysis of CTSD in GFP- or HBx-GFP-transfected Huh7 cells. Note the increase in Inter-CTSD and decrease in Mature-CTSD. Quantification shown on the right represents the relative CTSD protein levels normalized to ACTB and the data were from 3 independent experiments. Pre-CTSD, precursor cathepsin D; Inter-CTSD, intermediate cathepsin D; Mature-CTSD, mature form of cathepsin D; *, nonspecific bands. (F) Huh7 cells expressing Cherry or HBx-Cherry for 48 h were loaded with 1 mM Bodipy-FL-pepstatin A for 1 h. After 3 washes with PBS, the cells were visualized by confocal microscopy. Quantification shown on the right represents the number of Bodipy-FL-pepstatin A dots per cell in cells with Cherry or HBx-Cherry expression, n = 30. (G) Huh7 cells were transfected with HA-tagged V-ATPase V1D and GFP or HA-tagged V-ATPase V1D and HBx-GFP for 48 h. Then the cells were fixed, stained with HA and LAMP1 antibodies, and were imaged. (H) Huh7 cells expressing GFP or HBx-GFP were immunoprecipitated with anti-GFP antibody, and the immunocomplexes were analyzed by western blot with an anti-V-ATPase V1D antibody. All the quantitative data are presented as mean ± SEM ***P < 0.001. Scale bars: 10 µm.
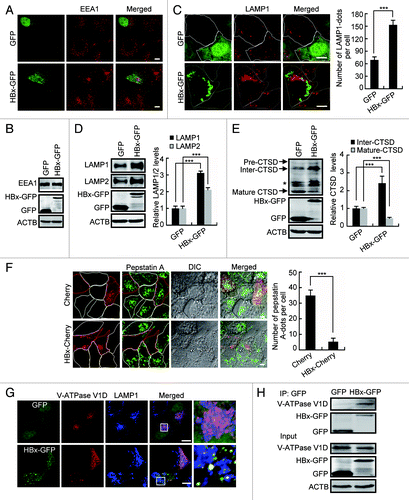
Figure 7. HBx inhibits the maturation of lysosomes. (A and B) Huh7 cells expressing GFP or HBx-GFP for 48 h were analyzed by either immunostaining (A) or western blot (B) using a specific EEA1 antibody. (C) Huh7 cells expressing GFP or HBx-GFP for 48 h were stained with LAMP1 antibody and imaged by confocal microscopy. Quantitation shown on the right represents the number of LAMP1 dots per cell in cells with GFP or HBx-GFP expression, n = 30. (D) Western blot analysis of LAMP1 and LAMP2 levels in Huh7 cells expressing GFP or HBx-GFP for 48 h, quantitation shown on the right represents the relative LAMP1/2 protein levels normalized to ACTB and the data were from 3 independent experiments. (E) Western blot analysis of CTSD in GFP- or HBx-GFP-transfected Huh7 cells. Note the increase in Inter-CTSD and decrease in Mature-CTSD. Quantification shown on the right represents the relative CTSD protein levels normalized to ACTB and the data were from 3 independent experiments. Pre-CTSD, precursor cathepsin D; Inter-CTSD, intermediate cathepsin D; Mature-CTSD, mature form of cathepsin D; *, nonspecific bands. (F) Huh7 cells expressing Cherry or HBx-Cherry for 48 h were loaded with 1 mM Bodipy-FL-pepstatin A for 1 h. After 3 washes with PBS, the cells were visualized by confocal microscopy. Quantification shown on the right represents the number of Bodipy-FL-pepstatin A dots per cell in cells with Cherry or HBx-Cherry expression, n = 30. (G) Huh7 cells were transfected with HA-tagged V-ATPase V1D and GFP or HA-tagged V-ATPase V1D and HBx-GFP for 48 h. Then the cells were fixed, stained with HA and LAMP1 antibodies, and were imaged. (H) Huh7 cells expressing GFP or HBx-GFP were immunoprecipitated with anti-GFP antibody, and the immunocomplexes were analyzed by western blot with an anti-V-ATPase V1D antibody. All the quantitative data are presented as mean ± SEM ***P < 0.001. Scale bars: 10 µm.

Figure 8. Lysosomal function assessed in human tissues. (A andB) Representative immunostaining (A) and western blot (B) analysis of LC3 in normal liver tissue from control individuals, liver tumor, and nontumor tissue from HBV-associated HCC individuals. Note the accumulation of LC3-puncta and LC3 in the tumor and nontumor samples. (C andD) Immunostaining (C) and western blot (D) analysis of SQSTM1 in the human tissues. (E) Immunostaining of LAMP1 in the human tissues. (F) Western blot analysis of LAMP1 and CTSD in the tissues. Note the reduction of the mature form and accumulation of the intermediate form. Scale bars: 10 µm.
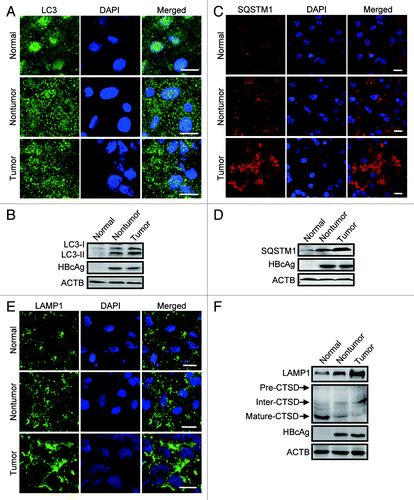
Figure 8. Lysosomal function assessed in human tissues. (A andB) Representative immunostaining (A) and western blot (B) analysis of LC3 in normal liver tissue from control individuals, liver tumor, and nontumor tissue from HBV-associated HCC individuals. Note the accumulation of LC3-puncta and LC3 in the tumor and nontumor samples. (C andD) Immunostaining (C) and western blot (D) analysis of SQSTM1 in the human tissues. (E) Immunostaining of LAMP1 in the human tissues. (F) Western blot analysis of LAMP1 and CTSD in the tissues. Note the reduction of the mature form and accumulation of the intermediate form. Scale bars: 10 µm.
Supplemental material

Additional material

Download Zip (240.2 KB)

Reprints and Corporate Permissions

Please note: Selecting permissions does not provide access to the full text of the article, please see our help page How do I view content?

To request a reprint or corporate permissions for this article, please click on the relevant link below:

Academic Permissions

Please note: Selecting permissions does not provide access to the full text of the article, please see our help page How do I view content?

Obtain permissions instantly via Rightslink by clicking on the button below:

If you are unable to obtain permissions via Rightslink, please complete and submit this Permissions form. For more information, please visit our Permissions help page.