Figures & data
Figure 1. Conditional knockout of CRYBA1 in RPE cells. (A) Three-dimensional modeling, depicting structures for CRYBA1 polypeptides. The normal βA3- and βA1-crystallin polypeptides, like all β-crystallins, form homo- and heterodimers and higher oligomers with other β-crystallins. Each polypeptide is comprised of 2 similar domains, which are extended such that each domain of 1 polypeptide interacts with 1 of the domains of another β-crystallin polypeptide. At left is shown the stable homodimer as would be found in the normal lens. Each polypeptide is an extended 2-domain structure with each domain interacting with one of the domains of the second polypeptide. The center model shows a single polypeptide with the Nuc1 mutation. Nuc1 is a spontaneous mutation in the Sprague-Dawley rat in which there is a 27 base-pair insertion in exon 6 of the Cryba1 gene (see ref. Citation16). The upper domain is normal (viewed from a different perspective), the lower domain is encoded in part by exon 6 containing the mutation with the inserted sequence constituting a loop (arrow) extending from the surface of the domain. It folds improperly, preventing stable dimer formation. To the right is modeled the portion of a CRYBA1 polypeptide produced by the conditional knockout construct. Only one severely altered domain is formed, eliminating any possibility of dimer formation or normal function. (B) Loss of CRYBA1 in the cryba1 cKO RPE cells is demonstrated by western blotting with CRYBA1-specific antibody. Cryba1fl/fl RPE clearly show expression of the A3 and A1 polypeptides of CRYBA1; expression of A3 and A1 is markedly decreased in cryba1 cKO RPE cells. This is consistent with the mosaic expression of Cre recombinase by the RPE cells with only 80% to 85% of the cells being positive for the enzyme (see ref. Citation17).
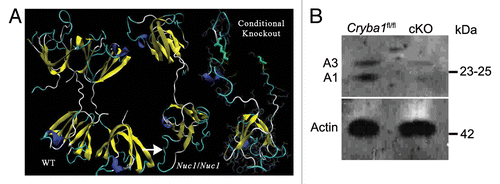
Figure 2. Age-dependent abnormalities in the RPE cells of cryba1 cKO mice. (A) RPE flatmounts from 7-mo-old Cryba1fl/fl and cKO mice were stained with DAPI for nuclei (red) and FITC-phalloidin to label the actin cytoskeleton (green). In Cryba1fl/fl RPE, cells are cuboidal and regularly arranged with cell membranes clearly defined by phalloidin staining (arrows). Cellular architecture is disordered in the cKO sample with poorly defined cell margins and weaker phalloidin staining. Bar: 50 μm. (B) Immunostaining of 12 mo old Cryba1fl/fl and cKO retinal sections with the lipid droplet marker PLIN2. PLIN2-positive lipid droplets (arrows) are present in the RPE layer of the Cryba1fl/fl retina, owing to age-related accumulation of lipids, but are much more prominent in the cKO sample. Based on an established grading system (see refs. Citation19 and Citation20), the Cryba1fl/fl scored 3 and the cKO scored 5 on a scale where 7 was maximal staining intensity. Bar: 10 µm. (C) Fundus photographs showed dark hyperpigmentation of RPE cells and subretinal lesions at the posterior pole in cKO mice by 4 mo of age. With increasing age, the lesions increased in number and were scattered throughout the fundus in cKO mice. n = 7 WT, 10 cKO mice. (D) Transmission electron microscopy of 2-mo-old cKO RPE shows many vacuole-like structures with degenerated membrane-bound cellular organelles (red arrows, center), undigested photoreceptor outer segments (red arrow, right) and loss and truncation of basal infoldings (blue asterisks), as compared with Cryba1fl/fl (left). Bar: 500 nm. (E) At 9 mo, RPE from cKO mice shows large vacuoles (blue arrows, middle image) containing partially degraded cellular debris. Interestingly, type 1 lysosomes are present in Cryba1fl/fl (green asterisks, left image), but rarely seen in cKO RPE. Moreover, loss of Cryba1 impedes lysosomal function because more melanosomes (red arrowheads) are retained in cKO, as compared with Cryba1fl/fl. The right image shows, at higher magnification, a degradative autophagic vacuole (Avd, red arrow) and a very large vacuole containing partially degraded cellular material (blue arrow) in a cKO sample. Bar: 2 μm.
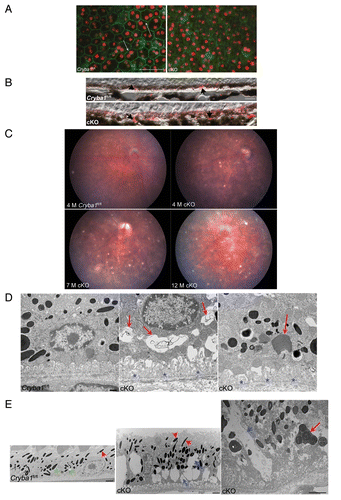
Figure 3. Phagosomes and autophagosomes in conditional knockout of CRYBA1 in RPE cells. (A) Transmission electron microscopy image from a 2-mo-old RPE of cryba1 cKO mouse showing phagosomes containing shed outer segment discs (arrows). Bar: 2 μm. (B) TEM showing the same phagosomes (as in A) at higher magnification to demonstrate that they are enclosed by a single membrane. Bar: 500 nm. (C) A 5-mo-old cryba1 cKO mouse RPE shows autophagosomes with double membranes (arrows). M designates mitochondria, which also have double membranes. Bar: 500 nm. (D) TEM images from RPE of a 7-mo-old cryba1 cKO mouse showing an autophagosome with double membrane (arrows). Bar: 500 nm. (E) A 12-mo-old starved Cryba1fl/fl mouse RPE shows a phagosome containing shed outer segment discs (arrow). Bar: 500 nm. (F) TEM showing an autophagosome with double membrane (arrows) in a 12-mo-old Cryba1fl/fl mouse following starvation. Bar: 500 nm.
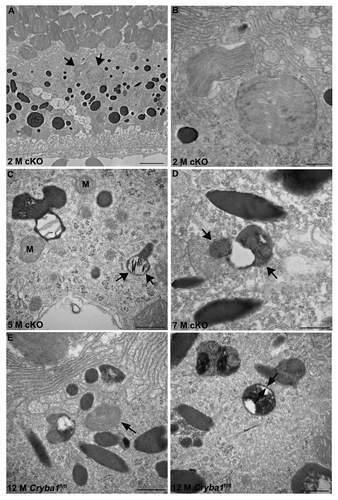
Figure 4. Loss of Cryba1 affects lysosomal acidification. (A) Subcellular fractionation as assessed by measuring the activity of HEXA, a lysosomal lumenal enzyme. The purification factor is calculated from the ratio of the specific activities by normalizing the specific activity of the post-nuclear supernatant (PNS) to 1. (B) Western blotting of lysosomal fractions showed CRYBA1 to be in the lysosomal lumen fraction (fraction 1), with minimal immunostaining in the lysosomal membrane fraction (fraction 2). LAMP1 and HEXA indicate the purity of the fractions. (C) Lysosomal pH in cultured primary RPE cells from Cryba1fl/fl mice was ~4.5, while in cKO cells it was ~5.2. The lysosomal pH was not significantly changed when cells were starved (St) to induce autophagy. (D) Overexpression of CRYBA1 in cKO cells reduced lysosomal pH to the normal value of 4.5, while empty vector had no effect. Graphs (C and D) show mean values and error bars represent s.d. from a triplicate experiment, representative of at least 3 independent experiments. Statistical analysis was performed by a 2-tailed Student t test: *P < 0.05.
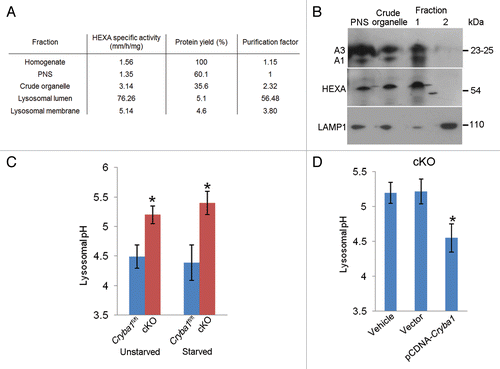
Figure 5. V-ATPase is regulated by CRYBA1 in RPE cells. (A) Left panel: V-ATPase activity in isolated lysosomes from Cryba1fl/fl RPE cells is about twice that of cKO cells. Bafilomycin A1 (Baf-1) reduced activity markedly in both cell types. Right panel: Overexpression of CRYBA1 in cultured RPE cells from cKO mice restored lysosomal V-ATPase activity to near normal level. The point of addition of ATP (1.4 μM final concentration) to activate the enzyme is indicated. Each point represents the average of 3 determinations; error bars represent mean ± s.d. (B) Coimmunoprecipitation of lysosomal lumen and membrane extracts from Cryba1fl/fl cells with CRYBA1 antibody and immunoblotting with V0-ATPase ATP6V0A1 antibody, demonstrating pulldown of V0-ATPase ATP6V0A1 by the crystallin antibody. Nonspecific IgG was used as negative control. (C) Hypothetical complex of open conformer of CRYBA3 and the V-ATPase monomer obtained by Hex Protein Docking is shown. Molecular surface of CRYBA3 is shown in green. The V-ATPase monomer is shown as a ribbon model where α-helical and β-sheet structures are shown by red arrows and blue cylinders, respectively.
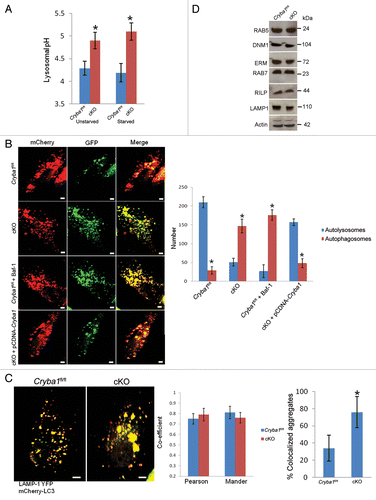
Figure 6. Loss of Cryba1 affects lysosome-mediated autophagic clearance in RPE. (A) Lysosomal pH was increased in RPE/choroid preparations from cKO relative to Cryba1fl/fl mice, with or without starvation-induced autophagy. (B) Single-frame images from live-cell imaging to visualize autophagosomes as yellow puncta (since both fluorophores fluoresce at cytoplasmic pH) and autolysosomes as red puncta (because GFP is quenched by the low pH of lysosomes) using the pH-sensitive reporter mcherry-GFP-LC3. In Cryba1fl/fl, most puncta were red indicating the fusion of autophagosome with lysosome, as expected. In cKO, most puncta were yellow suggesting that either fusion is inhibited or that fusion occurs but endolysosomal pH is too high to quench GFP fluorescence. The pattern seen in the cKO cells is similar to that seen in Cryba1fl/fl cells treated with bafilomycin A1 (Baf-1). Overexpression of CRYBA1 in the cKO cells (bottom panels) rescued the phenotype to that of Cryba1fl/fl. The numbers of autophagosomes and autolysosomes were quantified from at least 50 images per group per experiment. The histogram gives number of autophagosomes and autolysosomes for each of the 4 cells depicted. Bar: 20 μm. (C) Cryba1fl/fl and cKO cells transfected with both mCherry-LC3 to label autophagosomes and LAMP1-YFP to label lysosomes. Yellow fluorescence indicates fusion of the autophagosome and the lysosome. The extent of colocalization of LAMP1-YFP and mCherry-LC3 was determined by calculating the Pearson correlation coefficient and Mander overlap coefficient from 20 independent fields of cells in 3 different experiments. The colocalization coefficients (Pearson and Mander) were not significantly different in the Cryba1fl/fl and cKO cells. Percentage of LAMP1-YFP and mCherry-GFP colocalized aggregates was measured by using the ImageJ software. Colocalized aggregates were more numerous in cKO. Bar: 20 μm. (D) In autophagy-induced Cryba1fl/fl and cKO RPE cells, levels of the proteins involved in both the early maturation process (DNM1, RAB5 GTPase, and the EZR/Ezrin, RDX/Radixin and MSN/Moesin [ERM family of proteins]) and the later stages of maturation (RAB7 GTPase, RILP [Rab-interacting lysosomal protein], and LAMP1 [lysosomal-associated membrane protein 1]) are unaffected by loss of CRYBA1. In panels (A–C), graphs show mean values and error bars represent s.d. from a triplicate experiment, representative of at least 3 independent experiments. Statistical analysis was performed by a 2-tailed Student t test: *P < 0.05.
![Figure 6. Loss of Cryba1 affects lysosome-mediated autophagic clearance in RPE. (A) Lysosomal pH was increased in RPE/choroid preparations from cKO relative to Cryba1fl/fl mice, with or without starvation-induced autophagy. (B) Single-frame images from live-cell imaging to visualize autophagosomes as yellow puncta (since both fluorophores fluoresce at cytoplasmic pH) and autolysosomes as red puncta (because GFP is quenched by the low pH of lysosomes) using the pH-sensitive reporter mcherry-GFP-LC3. In Cryba1fl/fl, most puncta were red indicating the fusion of autophagosome with lysosome, as expected. In cKO, most puncta were yellow suggesting that either fusion is inhibited or that fusion occurs but endolysosomal pH is too high to quench GFP fluorescence. The pattern seen in the cKO cells is similar to that seen in Cryba1fl/fl cells treated with bafilomycin A1 (Baf-1). Overexpression of CRYBA1 in the cKO cells (bottom panels) rescued the phenotype to that of Cryba1fl/fl. The numbers of autophagosomes and autolysosomes were quantified from at least 50 images per group per experiment. The histogram gives number of autophagosomes and autolysosomes for each of the 4 cells depicted. Bar: 20 μm. (C) Cryba1fl/fl and cKO cells transfected with both mCherry-LC3 to label autophagosomes and LAMP1-YFP to label lysosomes. Yellow fluorescence indicates fusion of the autophagosome and the lysosome. The extent of colocalization of LAMP1-YFP and mCherry-LC3 was determined by calculating the Pearson correlation coefficient and Mander overlap coefficient from 20 independent fields of cells in 3 different experiments. The colocalization coefficients (Pearson and Mander) were not significantly different in the Cryba1fl/fl and cKO cells. Percentage of LAMP1-YFP and mCherry-GFP colocalized aggregates was measured by using the ImageJ software. Colocalized aggregates were more numerous in cKO. Bar: 20 μm. (D) In autophagy-induced Cryba1fl/fl and cKO RPE cells, levels of the proteins involved in both the early maturation process (DNM1, RAB5 GTPase, and the EZR/Ezrin, RDX/Radixin and MSN/Moesin [ERM family of proteins]) and the later stages of maturation (RAB7 GTPase, RILP [Rab-interacting lysosomal protein], and LAMP1 [lysosomal-associated membrane protein 1]) are unaffected by loss of CRYBA1. In panels (A–C), graphs show mean values and error bars represent s.d. from a triplicate experiment, representative of at least 3 independent experiments. Statistical analysis was performed by a 2-tailed Student t test: *P < 0.05.](/cms/asset/18bffab9-aec8-4dfb-8d6a-2c6e34509d66/kaup_a_10927292_f0006.gif)
Figure 7. Decreased autophagy in RPE deficient in Cryba1. (A) Cryba1fl/fl and cKO cells were transfected with GFP-LC3. GFP-LC3 was uniformly distributed in both cell types (left panels). Following autophagy induction (St), GFP fluorescence appeared as punctate spots representing autophagosomes and autolysosomes, which were more dense in the cKO cells than in Cryba1fl/fl. Bafilomycin A1 (Baf-1, right panels) increased puncta density in Cryba1fl/fl, but had no obvious effect in the cKO cells. The histogram demonstrates a statistically significant increase in puncta in Cryba1fl/fl following treatment with bafilomycin A1, but no such increase in cKO cells. After autophagy induction, cKO cells had about twice as many puncta as Cryba1fl/fl cells. Bar: 30 μm. (B) GFP-LC3-positive puncta were significantly diminished in the cKO cells when CRYBA1 was overexpressed. Empty vector had no effect. Bar: 30 μm. (C) Level of LC3-II is increased to greater extent by 12 h of starvation (st) in cKO cells than in Cryba1fl/fl. Exposure to 20 nM rapamycin (Rapa) for 12 h also increased LC3-II levels, especially in the cKO cells. Bafilomycin A1 markedly increased LC3-II in both cell types. The histogram shows that the LC3-flux ratio (speed of autophagy) is decreased by ~50% in cKO cells. In all panels, graphs show mean values and error bars represent s.d. from a triplicate experiment, representative of at least 3 independent experiments. For the quantification of GFP-LC3 puncta, at least 100 cells per group were counted and the percentage of GFP-LC3 puncta as shown are the mean ± s.d. of 3 individual experiments (in A and B). Statistical analysis was performed by a 2-tailed Student t test: *P < 0.05.
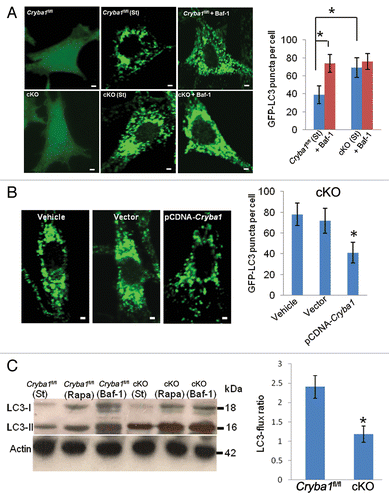
Figure 8. Decreased CTSD activity in RPE deficient of Cryba1. (A) CTSD activity in primary cultures of RPE cells from cKO mice was only about a third of normal. Starvation (St) to induce autophagy had no effect. (B) Overexpression of CRYBA1 in the cKO cells restored CTSD activity to the normal range. (C) CTSD activity was decreased by about 50% in freshly isolated RPE/choroid preparations from cKO mice as compared with Cryba1fl/fl samples. Activity was not significantly affected by induction of autophagy in vivo. Graphs show mean values and error bars represent s.d. from a triplicate experiment representative of at least 3 independent experiments. Statistical analysis was performed by a 2-tailed Student t test: *P < 0.05.
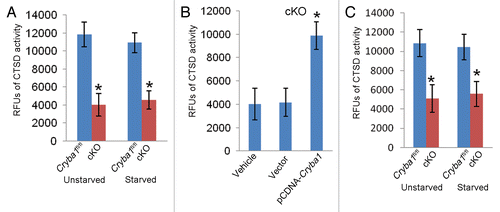
Figure 9.Cryba1 regulates the MTORC1 signaling pathway. (A) Following induction of autophagy in vivo by starvation, RPE/choroid was isolated and levels of signaling intermediates determined. In the cKO samples p-AKT was decreased compared with Cryba1fl/fl, while p-MTOR was increased. Total AKT and total MTOR were not changed. (B) In starved RPE cells cultured from cKO mice, overexpression of CRYBA1 increased p-AKT and p-RPTOR expression, while p-MTOR decreased. (C) Conversely, downregulation of βA3/A1- crystallin expression in Cryba1fl/fl cells using siRNA, decreased p-AKT, and p-RPTOR while p-MTOR was upregulated. (D) Rapamycin, an inhibitor of MTOR, was effective at decreasing p-MTOR and increasing p-RPTOR levels in the cKO cells.
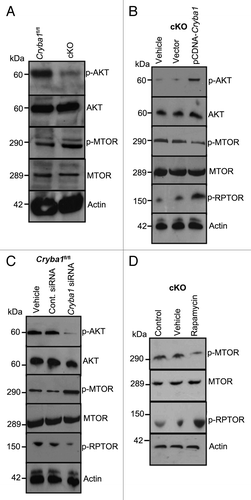
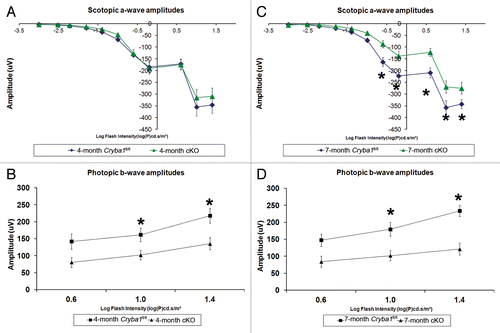
Figure 10. Decreased lysosomal clearance leads to loss of cellular homeostasis in RPE of cryba1 cKO mice. (A) Scotopic ERGs from eyes of 4-mo-old cryba1 cKO mice showed similar a-wave amplitudes as those in Cryba1fl/fl mice (n = 10 for each group), indicating that rod photoreceptor function was not affected. (B) Photopic ERGs of cKO mice from the same age (4 mo) showed smaller b-wave amplitudes in comparison to Cryba1fl/fl mice (n = 10 for each group), indicating reduced cone photoreceptor function (*P ≤ 0.018 by ANOVA with Dunnett correction for multiple comparisons). (C) Scotopic ERGs from 7-mo-old cKO mice showed decreased a-wave amplitudes when compared with Cryba1fl/fl mice (n = 10 for each group), demonstrating that rod photoreceptor function was reduced significantly (*P ≤ 0.0002 by ANOVA with Dunnett correction for multiple comparisons). (D) Photopic ERGs from these 7-mo-old cKO mice also showed further decrease in b-wave amplitudes compared with Cryba1fl/fl mice (n = 10 for each group), indicating the cone function had been reduced (*P ≤ 0.0001 by ANOVA with Dunnett correction for multiple comparisons).
