1,677
Views
55
CrossRef citations to date
0
Altmetric
Basic Research Paper

Human autophagy gene ATG16L1 is post-transcriptionally regulated by MIR142-3p

, , , , , & show all
Pages 468-479 | Received 16 Jan 2013, Accepted 16 Dec 2013, Published online: 06 Jan 2014

Figures & data

Figure 1.ATG16L1 3′UTR reduces firefly luciferase activity. (A) pMIR-GLO reporter vectors were constructed containing the ATG16L1 WT 3′UTR or truncated 3′UTR fragments, F1, F2, and F3, which were 384, 697, and 1071 nt in length, respectively. (B) HCT116 cells were transfected with the vectors containing the WT, F1, F2 or F3 ATG16L1 3′UTR or a pMIR-GLO vector control (200 ng/ml or 50 ng/well in 48-well plates). Firefly luciferase activity was measured and normalized to renilla luciferase activity. The data are expressed as the mean ± SEM (n = 4). **P < 0.01 vs the control pMIR-GLO vector. P < 0.01 vs the 3′UTR F1. #P < 0.05 vs the 3′UTR F2.

Figure 1.ATG16L1 3′UTR reduces firefly luciferase activity. (A) pMIR-GLO reporter vectors were constructed containing the ATG16L1 WT 3′UTR or truncated 3′UTR fragments, F1, F2, and F3, which were 384, 697, and 1071 nt in length, respectively. (B) HCT116 cells were transfected with the vectors containing the WT, F1, F2 or F3 ATG16L1 3′UTR or a pMIR-GLO vector control (200 ng/ml or 50 ng/well in 48-well plates). Firefly luciferase activity was measured and normalized to renilla luciferase activity. The data are expressed as the mean ± SEM (n = 4). **P < 0.01 vs the control pMIR-GLO vector. ‡P < 0.01 vs the 3′UTR F1. #P < 0.05 vs the 3′UTR F2.
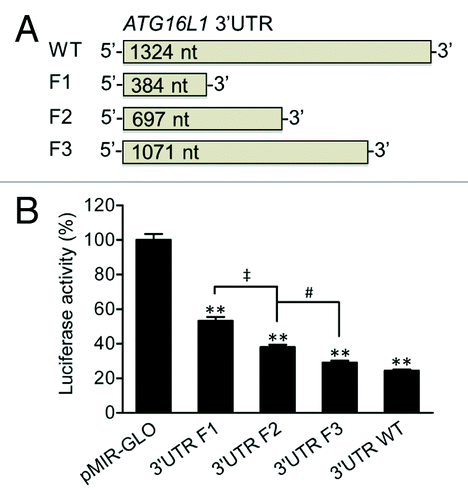
Figure 2. Predicted miRNAs are expressed in HCT116 cells. (A) An in silico analysis identified MIR30B*, MIR142-3p, MIR505*, MIR548B-3p, and MIR770-5p as having putative binding sites in the first half of the ATG16L1 3′UTR in the 5′ end. (B) The endogenous expression levels of the 5 putative miRNAs were analyzed by mature miRNA RT-PCR and normalized to RNU6B. The data are expressed as the mean ± SEM (n = 3).
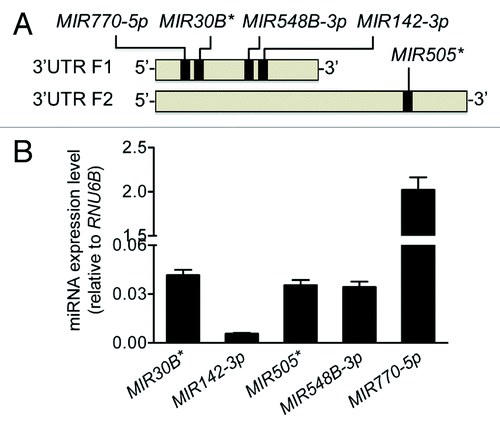
Figure 2. Predicted miRNAs are expressed in HCT116 cells. (A) An in silico analysis identified MIR30B*, MIR142-3p, MIR505*, MIR548B-3p, and MIR770-5p as having putative binding sites in the first half of the ATG16L1 3′UTR in the 5′ end. (B) The endogenous expression levels of the 5 putative miRNAs were analyzed by mature miRNA RT-PCR and normalized to RNU6B. The data are expressed as the mean ± SEM (n = 3).

Figure 3.MIR142-3p regulates ATG16L1 expression. HCT116 cells were transfected with individual miRNA mimics or a mimic negative control (MIRNC) (50 nM). At 24 h post-transfection, (A) total RNA was extracted and assayed for ATG16L1 mRNA expression by real-time RT-PCR. The data are expressed as the mean ± SEM (n = 3). **P < 0.01 vs MIRNC; (B) whole cell lysates were assayed by western blot for ATG16L1 protein expression. The density of ATG16L1 isoform 1 (Iso1) and isoform 2 (Iso2) bands was quantitated using the Odyssey infrared imaging system and normalized to that of the corresponding loading control ACTB with the same treatment. Representative bands are shown.
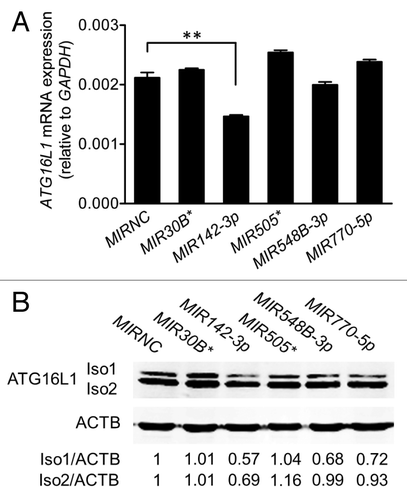
Figure 3.MIR142-3p regulates ATG16L1 expression. HCT116 cells were transfected with individual miRNA mimics or a mimic negative control (MIRNC) (50 nM). At 24 h post-transfection, (A) total RNA was extracted and assayed for ATG16L1 mRNA expression by real-time RT-PCR. The data are expressed as the mean ± SEM (n = 3). **P < 0.01 vs MIRNC; (B) whole cell lysates were assayed by western blot for ATG16L1 protein expression. The density of ATG16L1 isoform 1 (Iso1) and isoform 2 (Iso2) bands was quantitated using the Odyssey infrared imaging system and normalized to that of the corresponding loading control ACTB with the same treatment. Representative bands are shown.

Figure 4.MIR142-3p targets the ATG16L1 3′UTR. (A) HCT116 cells were cotransfected with the F1 vector (200 ng/ml) and a miRNA mimic (10 nM), and luciferase reporter assays were performed 48 h after transfection. The data are expressed as the mean ± SEM (n = 4). **P < 0.01 vs the MIRNC. (B) To validate the predicted MIR142-3p binding sequence in the ATG16L1 3′UTR, 11 nucleotides at position 254 to 264 in the truncated F1 vector were substituted. (C) HCT116 cells were cotransfected with the WT or mutated F1 (200 ng/ml) vector and the MIR142-3p mimic or MIRNC (10 nM). At 48 h post-transfection, dual luciferase activities were determined. The data are expressed as the mean ± SEM (n = 4). *P < 0.05 and ***P < 0.001 vs the MIRNC.
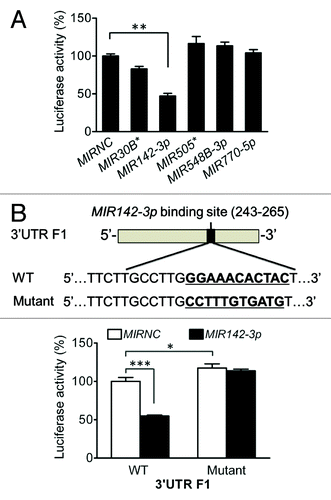
Figure 4.MIR142-3p targets the ATG16L1 3′UTR. (A) HCT116 cells were cotransfected with the F1 vector (200 ng/ml) and a miRNA mimic (10 nM), and luciferase reporter assays were performed 48 h after transfection. The data are expressed as the mean ± SEM (n = 4). **P < 0.01 vs the MIRNC. (B) To validate the predicted MIR142-3p binding sequence in the ATG16L1 3′UTR, 11 nucleotides at position 254 to 264 in the truncated F1 vector were substituted. (C) HCT116 cells were cotransfected with the WT or mutated F1 (200 ng/ml) vector and the MIR142-3p mimic or MIRNC (10 nM). At 48 h post-transfection, dual luciferase activities were determined. The data are expressed as the mean ± SEM (n = 4). *P < 0.05 and ***P < 0.001 vs the MIRNC.

Figure 5.MIR142-3p regulates starvation-induced autophagy in HCT116 cells. HCT116 cells were transfected with a miRNA mimic or MIRNC (50 nM). At 24 h post-transfection, cells were directly collected (A) or incubated in EBSS for autophagy induction for another 4 h (B). Autophagy was monitored based on the LC3 turnover and SQSTM1 degradation by western blot. The band densities were quantitated and the ratios of LC3-II/LC3-I and SQSTM1/GAPDH (or ACTB) were calculated and normalized. (C) LC3-II puncta were visualized by confocal imaging of cells immunostained for nucleus and LC3 using DAPI (blue) and Alexa Fluor 488 secondary antibody conjugates (green), respectively. Arrow indicates increasing LC3-II puncta. Representative imaging are shown. (D) LC3-II puncta per cell were quantitated by randomly counting 20 cells for each treatment group and the data are expressed as the mean ± SEM (n = 20). (E) Real-time RT-PCR analysis of MAP1LC3B mRNA expression. The data were expressed as the mean ± SEM (n = 6).
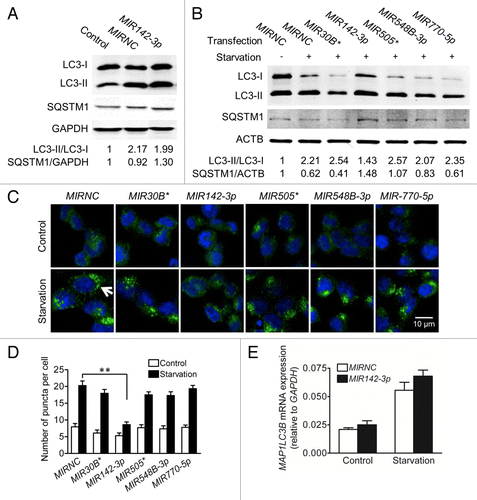
Figure 5.MIR142-3p regulates starvation-induced autophagy in HCT116 cells. HCT116 cells were transfected with a miRNA mimic or MIRNC (50 nM). At 24 h post-transfection, cells were directly collected (A) or incubated in EBSS for autophagy induction for another 4 h (B). Autophagy was monitored based on the LC3 turnover and SQSTM1 degradation by western blot. The band densities were quantitated and the ratios of LC3-II/LC3-I and SQSTM1/GAPDH (or ACTB) were calculated and normalized. (C) LC3-II puncta were visualized by confocal imaging of cells immunostained for nucleus and LC3 using DAPI (blue) and Alexa Fluor 488 secondary antibody conjugates (green), respectively. Arrow indicates increasing LC3-II puncta. Representative imaging are shown. (D) LC3-II puncta per cell were quantitated by randomly counting 20 cells for each treatment group and the data are expressed as the mean ± SEM (n = 20). (E) Real-time RT-PCR analysis of MAP1LC3B mRNA expression. The data were expressed as the mean ± SEM (n = 6).

Figure 6.MIR142-3p regulates starvation-induced autophagy in Jurtak T cells. Jurkat T cells were transfected with a MIR142-3p inhibitor or control inhibitor (50 nM). After overnight culture, cells were incubated in EBSS for 2 h. Cell pellets were treated with 0.05% saponin to release soluble LC3-I and then incubated with anti-LC3B antibody or isotype control antibody. Flow cytometry was performed after incubation with an Alexa Fluor 488 anti-rabbit secondary antibody. Representative scatter plots and histograms of flow cytometry for the (A) isotype control antibody and for LC3-II in (B) MIR142-3p inhibitor-transfected cells and (C) control inhibitor-transfected cells are presented. LC3-II was increased in cells transfected with the MIR142-3p inhibitor as compared with the control inhibitor. Data represents 2 independent experiments.
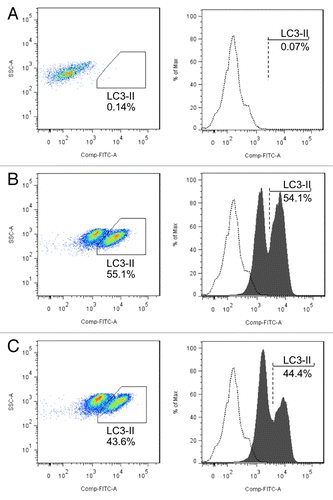
Figure 6.MIR142-3p regulates starvation-induced autophagy in Jurtak T cells. Jurkat T cells were transfected with a MIR142-3p inhibitor or control inhibitor (50 nM). After overnight culture, cells were incubated in EBSS for 2 h. Cell pellets were treated with 0.05% saponin to release soluble LC3-I and then incubated with anti-LC3B antibody or isotype control antibody. Flow cytometry was performed after incubation with an Alexa Fluor 488 anti-rabbit secondary antibody. Representative scatter plots and histograms of flow cytometry for the (A) isotype control antibody and for LC3-II in (B) MIR142-3p inhibitor-transfected cells and (C) control inhibitor-transfected cells are presented. LC3-II was increased in cells transfected with the MIR142-3p inhibitor as compared with the control inhibitor. Data represents 2 independent experiments.

Figure 7.MIR142-3p regulates L18-MDP-induced autophagy and IL8 gene expression. (A) HCT116 cells were transfected with the MIR142-3p mimic or MIRNC (50 nM) and at 48 h post-transfection, cells were treated L18-MDP (100 ng/ml) in the presence or absence of bafilomycin A1 (100 nM) for 2 h. Autophagy was monitored by western blot analysis of LC3 turnover and SQSTM1 degradation. (B) As in A, cells were transfected with the MIR142-3p mimic or MIRNC (10 nM) and at 24 h post-transfection, cells were treated with L18-MDP (100 ng/ml) in fresh complete medium for 4 h. L18-MDP-induced inflammatory response was measured using increasing IL8 mRNA expression as an indicator. The data are expressed as the mean ± SEM (n = 3). ***P < 0.001 vs the baseline control transfected with MIRNC. ###P < 0.001 vs the L18-MDP-treated control transfected with MIRNC.
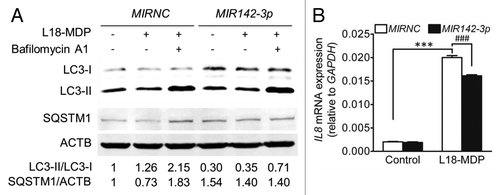
Figure 7.MIR142-3p regulates L18-MDP-induced autophagy and IL8 gene expression. (A) HCT116 cells were transfected with the MIR142-3p mimic or MIRNC (50 nM) and at 48 h post-transfection, cells were treated L18-MDP (100 ng/ml) in the presence or absence of bafilomycin A1 (100 nM) for 2 h. Autophagy was monitored by western blot analysis of LC3 turnover and SQSTM1 degradation. (B) As in A, cells were transfected with the MIR142-3p mimic or MIRNC (10 nM) and at 24 h post-transfection, cells were treated with L18-MDP (100 ng/ml) in fresh complete medium for 4 h. L18-MDP-induced inflammatory response was measured using increasing IL8 mRNA expression as an indicator. The data are expressed as the mean ± SEM (n = 3). ***P < 0.001 vs the baseline control transfected with MIRNC. ###P < 0.001 vs the L18-MDP-treated control transfected with MIRNC.

Figure 8.MIR142-3p increases cell death induced by starvation. HCT116 cells were seeded in 96-well plates. After transfection with the MIR142-3p mimic or MIRNC (50 nM), cells were incubated in normal complete medium or in EBSS for starvation induction for 24 h. (A) Cell viability was determined using a colorimetric assay kit. (B) Apoptosis was determined by assaying the CASP3 and CASP7 activities. RFU indicates relative fluorescence units. The data are expressed as the mean ± SEM (n = 3). **P < 0.01 and ***P < 0.001 vs the unstarved control transfected with MIRNC. #P < 0.05 vs the starved control transfected with MIRNC.
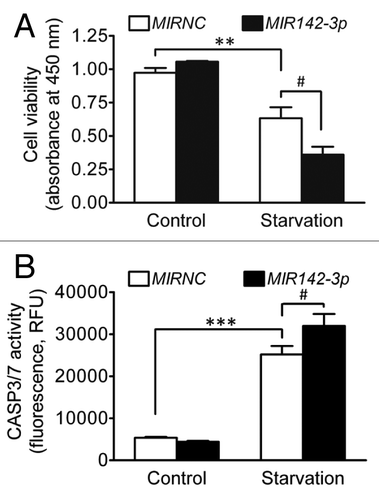
Figure 8.MIR142-3p increases cell death induced by starvation. HCT116 cells were seeded in 96-well plates. After transfection with the MIR142-3p mimic or MIRNC (50 nM), cells were incubated in normal complete medium or in EBSS for starvation induction for 24 h. (A) Cell viability was determined using a colorimetric assay kit. (B) Apoptosis was determined by assaying the CASP3 and CASP7 activities. RFU indicates relative fluorescence units. The data are expressed as the mean ± SEM (n = 3). **P < 0.01 and ***P < 0.001 vs the unstarved control transfected with MIRNC. #P < 0.05 vs the starved control transfected with MIRNC.

Figure 9. Starvation coinduces ATG16L1 and MIR142-3p. HCT116 cells were incubated in EBSS for different time points (0 to 6 h), then the relative expression levels of ATG16L1 mRNA and endogenous mature MIR142-3p were assessed by qRT-PCR and normalized with GAPDH and RNU6B, respectively. The expression levels of both ATG16L1 and MIR142-3p for the unstarved controls are considered as 100%. The data are expressed as the mean ± SEM (n = 3). *P < 0.05 and **P < 0.01 vs the corresponding unstarved control. #P < 0.05 vs the ATG16L1 mRNA expression at 1 h.
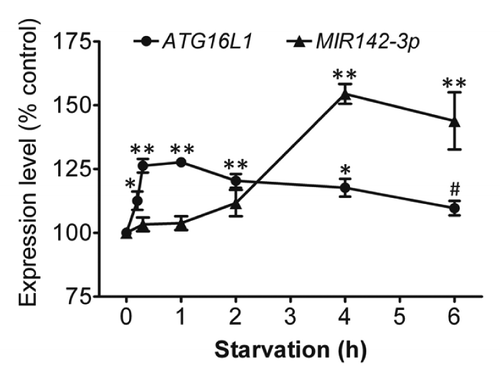
Figure 9. Starvation coinduces ATG16L1 and MIR142-3p. HCT116 cells were incubated in EBSS for different time points (0 to 6 h), then the relative expression levels of ATG16L1 mRNA and endogenous mature MIR142-3p were assessed by qRT-PCR and normalized with GAPDH and RNU6B, respectively. The expression levels of both ATG16L1 and MIR142-3p for the unstarved controls are considered as 100%. The data are expressed as the mean ± SEM (n = 3). *P < 0.05 and **P < 0.01 vs the corresponding unstarved control. #P < 0.05 vs the ATG16L1 mRNA expression at 1 h.
Supplemental material

Additional material

Download Zip (782.7 KB)

Reprints and Corporate Permissions

Please note: Selecting permissions does not provide access to the full text of the article, please see our help page How do I view content?

To request a reprint or corporate permissions for this article, please click on the relevant link below:

Academic Permissions

Please note: Selecting permissions does not provide access to the full text of the article, please see our help page How do I view content?

Obtain permissions instantly via Rightslink by clicking on the button below:

If you are unable to obtain permissions via Rightslink, please complete and submit this Permissions form. For more information, please visit our Permissions help page.