3,319
Views
41
CrossRef citations to date
0
Altmetric
Basic Research Paper

Phosphorylation of NBR1 by GSK3 modulates protein aggregation

, , , , , , & show all
Pages 1036-1053 | Received 27 Aug 2013, Accepted 08 Mar 2014, Published online: 31 Mar 2014

Figures & data

Figure 1. NBR1 is phosphorylated by GSK3. (A) Schematic representation of NBR1 functional protein domains. Amino acid positions of phosphorylated threonine and serine residues (letter P in circle) on the human protein are shown. PB1, Phox, and Bemp1 domain; ZZ, ZZ-type zinc finger; CC1 and 2, coiled-coil domains; LIR1 and 2, LC3-interacting regions; J, juxta-UBA domain (membrane-interacting amphipathic α-helix), UBA, ubiquitin-associated domain. Alignment of NBR1 amino acids flanking GSK3 putative phosphorylation consensus site shows conservation of threonine and serine residues (indicated by stars) in different species. Gray color shows amino acids conserved in all depicted species, and numbers above stars indicate threonine and serine residue positions in the human NBR1 protein. H. sapiens, Homo sapiens; M. musculus, Mus musculus; G. gallus, Gallus gallus; X. tropicalis, Xenopus tropicalis; D. rerio, Danio rerio. (B) GSK3 in vitro kinase assays. GST-tagged GSK3A or GSK3B forms (wt, wild-type; inactive, GSK3A K148A or GSK3B K85A; active, GSK3A S21A or GSK3B S9A) and wild-type GST-tagged NBR1 proteins were purified from 293T cells and mixed with radioactive γ−32P ATP. The upper panel shows radioactive 32P signal and the lower panels show GST-tagged protein amounts revealed with an anti-GST antibody. Arrows indicate the bands corresponding to phosphorylation of NBR1 by GSK3, GSK3 autophosphorylation, and total proteins. (C) GSK3 in vitro kinase assays performed with purified active (S9A) or inactive (K85A) GST-GSK3B mutants mixed with wild-type or mutant GST-NBR1. Thr581, Thr586, and Ser590 were mutated to nonphosphorylable alanine (3Mut., T581A T586A S590A). Lower panel: adjusted phosphorylation signal calculated as the ratio of the relative amount of phosphorylated NBR1 (32P signal) to total GST-NBR1. (D) Western blot showing the specificity of an antibody generated against human NBR1 phosphorylated at threonine 586. Human HeLa cells and murine C2C12 cells were transfected with a control siRNA targeting luciferase or human or mouse NBR1-specific siRNA. (E) Western blot showing the level of phospho-NBR1T586 signal in gsk3a−/− MEFs cotransfected with plasmids encoding GST or GST-GSK3A forms (wt, wild-type; inactive, K148A; active, S21A) and DsRed-NBR1 forms (wt, wild-type; nonphosphorylable, T586A). Phosphorylation of NBR1 by endogenous GSK3B is detectable in the absence of wild-type and active GST-GSK3A. The phosphorylation status of this signal was confirmed through treatment of gsk3a−/− MEF protein extracts with lambda-phosphatase. (F) Confocal pictures showing the immunofluorescence staining of anti-phospho-NBR1T586 in C2C12 myoblasts transfected with wild-type DsRed-NBR1 or the nonphosphorylable DsRed-NBR1 T586A S590A double mutant. Inserts correspond to a magnification of the dotted frame in each picture. Right panels are merged pictures showing the presence or absence of colocalization. Scale bar: 15 μm. Data in this figure are representative of at least 2 independent experiments.
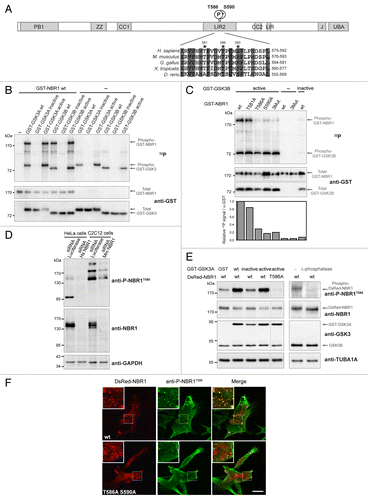
Figure 1. NBR1 is phosphorylated by GSK3. (A) Schematic representation of NBR1 functional protein domains. Amino acid positions of phosphorylated threonine and serine residues (letter P in circle) on the human protein are shown. PB1, Phox, and Bemp1 domain; ZZ, ZZ-type zinc finger; CC1 and 2, coiled-coil domains; LIR1 and 2, LC3-interacting regions; J, juxta-UBA domain (membrane-interacting amphipathic α-helix), UBA, ubiquitin-associated domain. Alignment of NBR1 amino acids flanking GSK3 putative phosphorylation consensus site shows conservation of threonine and serine residues (indicated by stars) in different species. Gray color shows amino acids conserved in all depicted species, and numbers above stars indicate threonine and serine residue positions in the human NBR1 protein. H. sapiens, Homo sapiens; M. musculus, Mus musculus; G. gallus, Gallus gallus; X. tropicalis, Xenopus tropicalis; D. rerio, Danio rerio. (B) GSK3 in vitro kinase assays. GST-tagged GSK3A or GSK3B forms (wt, wild-type; inactive, GSK3A K148A or GSK3B K85A; active, GSK3A S21A or GSK3B S9A) and wild-type GST-tagged NBR1 proteins were purified from 293T cells and mixed with radioactive γ−32P ATP. The upper panel shows radioactive 32P signal and the lower panels show GST-tagged protein amounts revealed with an anti-GST antibody. Arrows indicate the bands corresponding to phosphorylation of NBR1 by GSK3, GSK3 autophosphorylation, and total proteins. (C) GSK3 in vitro kinase assays performed with purified active (S9A) or inactive (K85A) GST-GSK3B mutants mixed with wild-type or mutant GST-NBR1. Thr581, Thr586, and Ser590 were mutated to nonphosphorylable alanine (3Mut., T581A T586A S590A). Lower panel: adjusted phosphorylation signal calculated as the ratio of the relative amount of phosphorylated NBR1 (32P signal) to total GST-NBR1. (D) Western blot showing the specificity of an antibody generated against human NBR1 phosphorylated at threonine 586. Human HeLa cells and murine C2C12 cells were transfected with a control siRNA targeting luciferase or human or mouse NBR1-specific siRNA. (E) Western blot showing the level of phospho-NBR1T586 signal in gsk3a−/− MEFs cotransfected with plasmids encoding GST or GST-GSK3A forms (wt, wild-type; inactive, K148A; active, S21A) and DsRed-NBR1 forms (wt, wild-type; nonphosphorylable, T586A). Phosphorylation of NBR1 by endogenous GSK3B is detectable in the absence of wild-type and active GST-GSK3A. The phosphorylation status of this signal was confirmed through treatment of gsk3a−/− MEF protein extracts with lambda-phosphatase. (F) Confocal pictures showing the immunofluorescence staining of anti-phospho-NBR1T586 in C2C12 myoblasts transfected with wild-type DsRed-NBR1 or the nonphosphorylable DsRed-NBR1 T586A S590A double mutant. Inserts correspond to a magnification of the dotted frame in each picture. Right panels are merged pictures showing the presence or absence of colocalization. Scale bar: 15 μm. Data in this figure are representative of at least 2 independent experiments.

Figure 2. GSK3 reduces protein aggregation through NBR1 phosphorylation. (A) Confocal pictures of C2C12 myoblasts left untreated or treated with 7.5 μg/ml puromycin for 2 h and stained for endogenous ubiquitin (UB, green), NBR1 (red), and SQSTM1 (violet). Scale bar: 20 μm. (B) Proportion of C2C12 myoblasts harboring protein aggregates under puromycin treatment. Cells were nontransfected or transfected with EGFP empty vector or EGFP-GSK3A forms (wt, wild-type; inactive, K148A; active, S21A). Cells were left untreated (control) or treated with puromycin. Immunostainings performed with anti-SQSTM1 and anti-UB antibodies revealed protein aggregates. Since all SQSTM1-positive aggregates were found UB-positive, transfected cells with and without SQSTM1-positive aggregates were counted. At least 200 transfected cells were counted for each condition. Error bar represent the 95% confidence interval. ***P < 0.001; Pearson Chi-square test with Yates continuity correction. Five independent experiments were performed. (C) Upper panel: confocal pictures of Gsk3b+/+ and gsk3b−/− MEFs left untreated or treated with 7.5 μg/ml puromycin for 4 h and stained with DAPI (blue) and anti-SQSTM1 (gray) to reveal protein aggregates. Scale bar: 50 μm. Lower panel: Proportion of cells harboring protein aggregates. At least 200 cells were counted for each condition. Error bar represent the 95% confidence interval. **P < 0.01; ***P < 0.001; Pearson Chi-square test with Yates continuity correction. The experiment was reproduced 2 times independently. (D) Confocal pictures of C2C12 myoblasts transfected with wild-type or N342D mutant MYC-tagged DES. DES was revealed by either an anti-MYC antibody (upper panel, green) or an anti-DES antibody (lower panel, green). Endogenous UB (upper panel, red), SQSTM1 (upper panel, violet), and NBR1 (lower panel, red) stainings were also performed. Right panels are enlargements of the corresponding dotted frame. Scale bar: 20 μm. (E) Proportion of C2C12 myoblasts harboring DES N342D-MYC aggregates. Cells were cotransfected with DES N342D-MYC and EGFP or EGFP-GSK3A mutants (inactive, K148A; active, S21A) together with DsRed, wild-type or mutant DsRed-NBR1 (T586A S590A, nonphosphorylable; T586E S590E, phosphomimetic). Cells were immunostained with anti-MYC antibody to reveal DES N342D-MYC. Proportions of MYC-, GFP-, and DsRed-positive cells with and without DES-MYC aggregates were quantified. At least 200 transfected cells were counted for each condition. Error bar represent the 95% confidence interval. *P < 0.05; ***P < 0.001; Pearson Chi-square test with Yates continuity correction. Three independent experiments were performed.
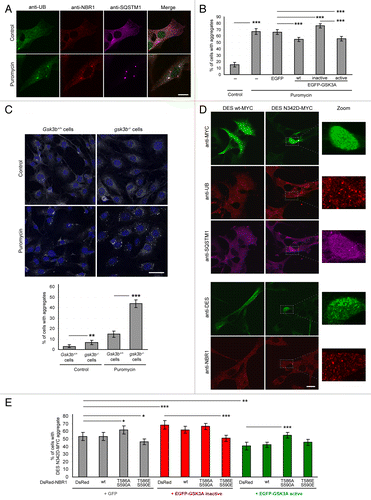
Figure 2. GSK3 reduces protein aggregation through NBR1 phosphorylation. (A) Confocal pictures of C2C12 myoblasts left untreated or treated with 7.5 μg/ml puromycin for 2 h and stained for endogenous ubiquitin (UB, green), NBR1 (red), and SQSTM1 (violet). Scale bar: 20 μm. (B) Proportion of C2C12 myoblasts harboring protein aggregates under puromycin treatment. Cells were nontransfected or transfected with EGFP empty vector or EGFP-GSK3A forms (wt, wild-type; inactive, K148A; active, S21A). Cells were left untreated (control) or treated with puromycin. Immunostainings performed with anti-SQSTM1 and anti-UB antibodies revealed protein aggregates. Since all SQSTM1-positive aggregates were found UB-positive, transfected cells with and without SQSTM1-positive aggregates were counted. At least 200 transfected cells were counted for each condition. Error bar represent the 95% confidence interval. ***P < 0.001; Pearson Chi-square test with Yates continuity correction. Five independent experiments were performed. (C) Upper panel: confocal pictures of Gsk3b+/+ and gsk3b−/− MEFs left untreated or treated with 7.5 μg/ml puromycin for 4 h and stained with DAPI (blue) and anti-SQSTM1 (gray) to reveal protein aggregates. Scale bar: 50 μm. Lower panel: Proportion of cells harboring protein aggregates. At least 200 cells were counted for each condition. Error bar represent the 95% confidence interval. **P < 0.01; ***P < 0.001; Pearson Chi-square test with Yates continuity correction. The experiment was reproduced 2 times independently. (D) Confocal pictures of C2C12 myoblasts transfected with wild-type or N342D mutant MYC-tagged DES. DES was revealed by either an anti-MYC antibody (upper panel, green) or an anti-DES antibody (lower panel, green). Endogenous UB (upper panel, red), SQSTM1 (upper panel, violet), and NBR1 (lower panel, red) stainings were also performed. Right panels are enlargements of the corresponding dotted frame. Scale bar: 20 μm. (E) Proportion of C2C12 myoblasts harboring DES N342D-MYC aggregates. Cells were cotransfected with DES N342D-MYC and EGFP or EGFP-GSK3A mutants (inactive, K148A; active, S21A) together with DsRed, wild-type or mutant DsRed-NBR1 (T586A S590A, nonphosphorylable; T586E S590E, phosphomimetic). Cells were immunostained with anti-MYC antibody to reveal DES N342D-MYC. Proportions of MYC-, GFP-, and DsRed-positive cells with and without DES-MYC aggregates were quantified. At least 200 transfected cells were counted for each condition. Error bar represent the 95% confidence interval. *P < 0.05; ***P < 0.001; Pearson Chi-square test with Yates continuity correction. Three independent experiments were performed.

Figure 3. GSK3-dependent NBR1 phosphorylation reduces ubiquitinated protein aggregation independently of autophagic degradation. (A) Western blot of detergent-soluble (Supernatant) and detergent-insoluble (Pellet) fractions of C2C12 myoblasts transfected with GST or GST-GSK3A forms (wt, wild-type; inactive, K148A; active, S21A) and treated with DMSO (control) or with 7.5 μg/ml puromycin + DMSO or + 200 nM bafilomycin A1 for 2 h. Endogenous NBR1, SQSTM1, UB, GAPDH (loading control), and ectopic GST-GSK3A were analyzed by western blot. Ratio of protein levels quantified in pellet fractions to protein levels in supernatant fractions (Ratio P/S) were calculated and normalized to GST conditions. Supernatant and pellet fractions were run on the same gels but different film exposures are shown in upper panels for correct visualization of all fractions. In the lower panel, SQSTM1 levels are presented at the same exposure as a readout of puromycin and bafilomycin A1 treatment efficiencies: the addition of puromycin blocks protein translation and increases protein aggregation resulting in a reduced amount of proteins in supernatant fractions compared with control conditions. The addition of bafilomycin A1 blocks lysosomal degradation resulting in an enhanced quantity of proteins in supernatant and pellet fractions. (B) Microscopy pictures of muscle transverse sections of Atg7 muscle-specific knockout mice electroporated with control, inactive (K148A) or active (S21A) EGFP-GSK3A mutant expression vectors together with Histone2B-RFP expression vector. Protein aggregates were revealed with an anti-SQSTM1 antibody (red) and nuclei were stained with DAPI (blue in Merge). White stars show EGFP-GSK3-transfected cells in the anti-SQSTM1 panel. Pictures are representative data of several mice (Control, 3 mice; Inactive GSK3A, 2 mice; Active GSK3A, 5 mice). Right panel: proportion of electroporated muscle fibers without (white part of histogram bars) or with (dark gray part of histogram bars) protein aggregates. At least 180 fibers were counted for each condition. Error bar represent the 95% confidence interval. ***P < 0.001; Pearson Chi-square test with Yates continuity correction. Scale bar: 50 μm. (C) Microscopy pictures of muscle transverse sections of Atg7 muscle-specific knockout mice electroporated with control or DsRed-NBR1 forms (wt, wild-type; T586A S590A, nonphosphorylable; T586E S590E, phosphomimetic). Pictures are representative data of 3 mice for each condition. Right panel: proportion of electroporated muscle fibers with no protein aggregate (white part of histogram bars), speckles (light gray) or with protein aggregates (dark gray). Representative pictures of the 3 types of fibers are depicted below the stacked histogram. Overexpression of NBR1 induces the formation of speckles (< 1-μm diameter), independently of its phosphorylation status. NBR1 phosphorylation affects the proportion of remaining aggregates (> 1-μm diameter). At least 80 fibers were counted for each condition. Error bars represent the 95% confidence interval. N.S. = no significant difference, ***P < 0.001; Pearson Chi-square test with Yates continuity correction. Scale bar: 50 μm.
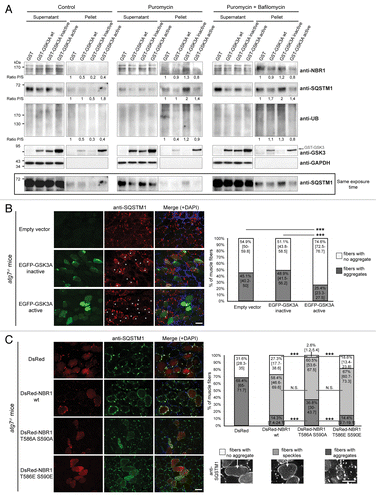
Figure 3. GSK3-dependent NBR1 phosphorylation reduces ubiquitinated protein aggregation independently of autophagic degradation. (A) Western blot of detergent-soluble (Supernatant) and detergent-insoluble (Pellet) fractions of C2C12 myoblasts transfected with GST or GST-GSK3A forms (wt, wild-type; inactive, K148A; active, S21A) and treated with DMSO (control) or with 7.5 μg/ml puromycin + DMSO or + 200 nM bafilomycin A1 for 2 h. Endogenous NBR1, SQSTM1, UB, GAPDH (loading control), and ectopic GST-GSK3A were analyzed by western blot. Ratio of protein levels quantified in pellet fractions to protein levels in supernatant fractions (Ratio P/S) were calculated and normalized to GST conditions. Supernatant and pellet fractions were run on the same gels but different film exposures are shown in upper panels for correct visualization of all fractions. In the lower panel, SQSTM1 levels are presented at the same exposure as a readout of puromycin and bafilomycin A1 treatment efficiencies: the addition of puromycin blocks protein translation and increases protein aggregation resulting in a reduced amount of proteins in supernatant fractions compared with control conditions. The addition of bafilomycin A1 blocks lysosomal degradation resulting in an enhanced quantity of proteins in supernatant and pellet fractions. (B) Microscopy pictures of muscle transverse sections of Atg7 muscle-specific knockout mice electroporated with control, inactive (K148A) or active (S21A) EGFP-GSK3A mutant expression vectors together with Histone2B-RFP expression vector. Protein aggregates were revealed with an anti-SQSTM1 antibody (red) and nuclei were stained with DAPI (blue in Merge). White stars show EGFP-GSK3-transfected cells in the anti-SQSTM1 panel. Pictures are representative data of several mice (Control, 3 mice; Inactive GSK3A, 2 mice; Active GSK3A, 5 mice). Right panel: proportion of electroporated muscle fibers without (white part of histogram bars) or with (dark gray part of histogram bars) protein aggregates. At least 180 fibers were counted for each condition. Error bar represent the 95% confidence interval. ***P < 0.001; Pearson Chi-square test with Yates continuity correction. Scale bar: 50 μm. (C) Microscopy pictures of muscle transverse sections of Atg7 muscle-specific knockout mice electroporated with control or DsRed-NBR1 forms (wt, wild-type; T586A S590A, nonphosphorylable; T586E S590E, phosphomimetic). Pictures are representative data of 3 mice for each condition. Right panel: proportion of electroporated muscle fibers with no protein aggregate (white part of histogram bars), speckles (light gray) or with protein aggregates (dark gray). Representative pictures of the 3 types of fibers are depicted below the stacked histogram. Overexpression of NBR1 induces the formation of speckles (< 1-μm diameter), independently of its phosphorylation status. NBR1 phosphorylation affects the proportion of remaining aggregates (> 1-μm diameter). At least 80 fibers were counted for each condition. Error bars represent the 95% confidence interval. N.S. = no significant difference, ***P < 0.001; Pearson Chi-square test with Yates continuity correction. Scale bar: 50 μm.

Figure 4. GSK3-mediated phosphorylation inhibits NBR1 adaptor function and this prevents the selective autophagy of ubiquitinated proteins. (A) Western blot of detergent-soluble (Supernatant) and detergent-insoluble (Pellet) fractions of HeLa cells treated with puromycin. Endogenous phospho-NBR1T586, total NBR1, SQSTM1, and TUBA1A/α-TUB (tubulin, α) (loading control) were analyzed by western blot. Arrows show bands that have been found to be specific in NBR1-specific siRNA experiments. The proportion of total NBR1 and phospho-NBR1T586 present in the insoluble fraction was calculated as the ratio of (signal of x in pellet fraction * 100)/(signal of x in supernatant fraction + signal of x in pellet). 24% of phospho-NBR1T586 is present in the detergent-insoluble fraction whereas 74% of total NBR1 is contained in this fraction. (B) Western blot of extracts from C2C12 myoblasts transfected with GST or GST-GSK3A forms (wt, wild-type; inactive, K148A; active, S21A). Cells were treated with CHX and proteins were extracted at different time points to determine NBR1 stability. Ectopic NBR1 was detected with anti-NBR1 antibody and the same patterns were observed with anti-GFP antibody (not shown). Lower panel: quantification of the percentage of NBR1 (left) and of ubiquitinated proteins (right) degradation after 6 h of CHX treatment compared with their initial amounts. Half-life time extrapolations calculated from the quantifications of western blot are shown in rectangles. Data are mean of 3 independent experiments. Error bars represent standard deviations. *P < 0.05, Student t test. (C) Western blot of extracts from C2C12 myoblasts transfected with wild-type or mutant EGFP-NBR1 and treated with CHX. Lower panel: Quantification of the percentage of EGFP-NBR1 (left) and of ubiquitinated proteins (right) degradation after 6 h of CHX treatment compared with their initial amounts. Half-life time extrapolations calculated from quantifications of western blot are shown in rectangles. Data are mean of 3 independent experiments. Error bars represent standard deviations. *P < 0.05, Student t test.
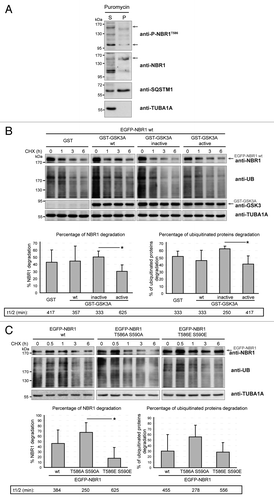
Figure 4. GSK3-mediated phosphorylation inhibits NBR1 adaptor function and this prevents the selective autophagy of ubiquitinated proteins. (A) Western blot of detergent-soluble (Supernatant) and detergent-insoluble (Pellet) fractions of HeLa cells treated with puromycin. Endogenous phospho-NBR1T586, total NBR1, SQSTM1, and TUBA1A/α-TUB (tubulin, α) (loading control) were analyzed by western blot. Arrows show bands that have been found to be specific in NBR1-specific siRNA experiments. The proportion of total NBR1 and phospho-NBR1T586 present in the insoluble fraction was calculated as the ratio of (signal of x in pellet fraction * 100)/(signal of x in supernatant fraction + signal of x in pellet). 24% of phospho-NBR1T586 is present in the detergent-insoluble fraction whereas 74% of total NBR1 is contained in this fraction. (B) Western blot of extracts from C2C12 myoblasts transfected with GST or GST-GSK3A forms (wt, wild-type; inactive, K148A; active, S21A). Cells were treated with CHX and proteins were extracted at different time points to determine NBR1 stability. Ectopic NBR1 was detected with anti-NBR1 antibody and the same patterns were observed with anti-GFP antibody (not shown). Lower panel: quantification of the percentage of NBR1 (left) and of ubiquitinated proteins (right) degradation after 6 h of CHX treatment compared with their initial amounts. Half-life time extrapolations calculated from the quantifications of western blot are shown in rectangles. Data are mean of 3 independent experiments. Error bars represent standard deviations. *P < 0.05, Student t test. (C) Western blot of extracts from C2C12 myoblasts transfected with wild-type or mutant EGFP-NBR1 and treated with CHX. Lower panel: Quantification of the percentage of EGFP-NBR1 (left) and of ubiquitinated proteins (right) degradation after 6 h of CHX treatment compared with their initial amounts. Half-life time extrapolations calculated from quantifications of western blot are shown in rectangles. Data are mean of 3 independent experiments. Error bars represent standard deviations. *P < 0.05, Student t test.

Figure 5. NBR1 phosphorylation is decreased in muscles of sIBM patients. (A) Confocal pictures of muscle sections from control, sIBM, and myotilinopathy patients stained for phospho-NBR1T586 (green), NBR1 (red), and SQSTM1 (violet). One to 5% of muscle fibers of sIBM patients show such protein aggregates. Nuclei were revealed with DAPI. All pictures have been acquired with the same laser gains. Scale bar: 20 μm. (B) Western blot analysis of endogenous phosphorylated and total NBR1, GSK3, and GYS1, and total CTNNB1 in protein extracts from control and sIBM patient muscle biopsies. (C) Tukey box plot of western blot phospho-NBR1T586 on NBR1 signal ratio. Boxes are delimited by quartiles Q1 and Q3 and crossed by median. Gray cross is the mean. Ends of bars are first and ninth deciles. Circles are minimum and maximum. Width of boxes is proportional to the effective: n = 14 controls and 13 sIBM patients. One sIBM sample with an extreme value has been excluded by Grubbs test at 5%. **P < 0.01, Student t test. (D) anti-P-NBR1T586/anti-NBR1 signals of each sIBM patient determined by western blot are represented as a function of scores of protein aggregation severity (cf Table S1). In gray is the trend line. r = Spearman rho correlation coefficient. P < 0.05: there is a significant inverse correlation between the level of remaining phospho-NBR1T586 and the severity of protein aggregation in sIBM muscle.
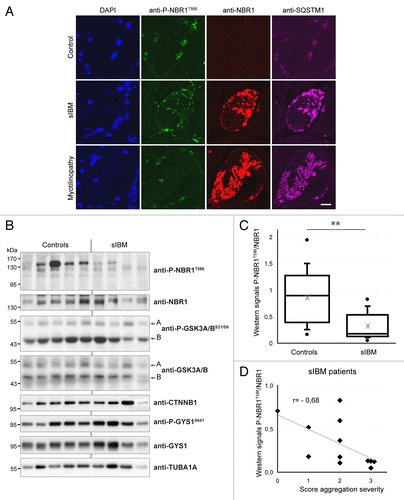
Figure 5. NBR1 phosphorylation is decreased in muscles of sIBM patients. (A) Confocal pictures of muscle sections from control, sIBM, and myotilinopathy patients stained for phospho-NBR1T586 (green), NBR1 (red), and SQSTM1 (violet). One to 5% of muscle fibers of sIBM patients show such protein aggregates. Nuclei were revealed with DAPI. All pictures have been acquired with the same laser gains. Scale bar: 20 μm. (B) Western blot analysis of endogenous phosphorylated and total NBR1, GSK3, and GYS1, and total CTNNB1 in protein extracts from control and sIBM patient muscle biopsies. (C) Tukey box plot of western blot phospho-NBR1T586 on NBR1 signal ratio. Boxes are delimited by quartiles Q1 and Q3 and crossed by median. Gray cross is the mean. Ends of bars are first and ninth deciles. Circles are minimum and maximum. Width of boxes is proportional to the effective: n = 14 controls and 13 sIBM patients. One sIBM sample with an extreme value has been excluded by Grubbs test at 5%. **P < 0.01, Student t test. (D) anti-P-NBR1T586/anti-NBR1 signals of each sIBM patient determined by western blot are represented as a function of scores of protein aggregation severity (cf Table S1). In gray is the trend line. r = Spearman rho correlation coefficient. P < 0.05: there is a significant inverse correlation between the level of remaining phospho-NBR1T586 and the severity of protein aggregation in sIBM muscle.

Figure 6. Proposed model of regulation of protein aggregation by GSK3-mediated phosphorylation of NBR1 (A) Under its nonphosphorylated form, NBR1 acts as an adaptor for ubiquitinated proteins. Misfolded or mutant proteins are polyubiquitinated (yellow circles) and recognized by NBR1, which interacts with their polyubiquitin tail and brings them together to form UB-bodies. (1) Under normal conditions, selective autophagy occurs. NBR1 brings ubiquitinated proteins to autophagosomes through interaction with LC3 present at their membrane. Fusion with lysosomes leads to the degradation of ubiquitinated proteins and autophagy receptors by lysosomal proteases. (2) Under stress or pathological conditions, cells are overloaded with misfolded or mutant proteins and degradation pathways are saturated. Accumulation of ubiquitinated proteins leads to the formation of protein aggregates. (B) When phosphorylated by GSK3, NBR1 does not participate to the formation of UB-bodies. Consequently, ubiquitinated proteins and NBR1 undergo decreased degradation.
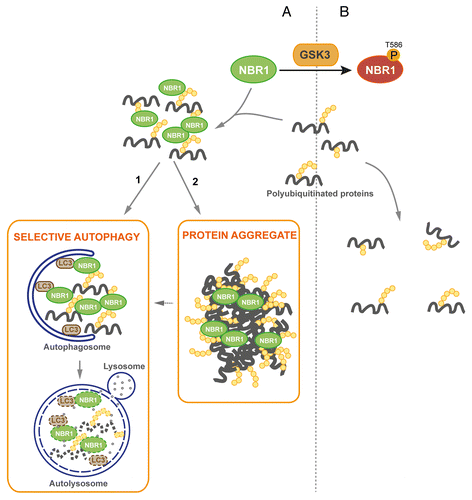
Figure 6. Proposed model of regulation of protein aggregation by GSK3-mediated phosphorylation of NBR1 (A) Under its nonphosphorylated form, NBR1 acts as an adaptor for ubiquitinated proteins. Misfolded or mutant proteins are polyubiquitinated (yellow circles) and recognized by NBR1, which interacts with their polyubiquitin tail and brings them together to form UB-bodies. (1) Under normal conditions, selective autophagy occurs. NBR1 brings ubiquitinated proteins to autophagosomes through interaction with LC3 present at their membrane. Fusion with lysosomes leads to the degradation of ubiquitinated proteins and autophagy receptors by lysosomal proteases. (2) Under stress or pathological conditions, cells are overloaded with misfolded or mutant proteins and degradation pathways are saturated. Accumulation of ubiquitinated proteins leads to the formation of protein aggregates. (B) When phosphorylated by GSK3, NBR1 does not participate to the formation of UB-bodies. Consequently, ubiquitinated proteins and NBR1 undergo decreased degradation.
Supplemental material

Additional material

Download Zip (1,008.9 KB)