1,951
Views
56
CrossRef citations to date
0
Altmetric
Basic Research Paper

DIRAS3 regulates the autophagosome initiation complex in dormant ovarian cancer cells

, , , , , , , , & show all
Pages 1071-1092 | Received 14 Jul 2013, Accepted 17 Mar 2014, Published online: 10 Apr 2014

Figures & data

Figure 1. DIRAS3 expression is important for induction of autophagy. (A) Induction of DIRAS3 mRNA is correlated with increased conversion of LC3-I to LC3-II. OVCA433 and EFO21 ovarian cancer cells were incubated in growth medium or HBSS plus 0.3% glucose for 2, 4, 8, or 16 h. Cells were collected for western blotting with antibodies and RNA was extracted for analysis by real-time PCR analyses. Band intensities were quantified using ImageJ. (B) Increasing endogenous DIRAS3 protein is correlated with increasing LC3 puncta. EFO21 cells were incubated in growth medium or in HBSS plus 0.3% glucose for 4 h. Cells were stained for DIRAS3 or LC3 and imaged by immunofluorescence microscopy. The quantities of LC3 puncta and the intensities of endogenous DIRAS3 protein were quantified using ImageJ. Scale bars: 5 μm. (C) Re-expression of DIRAS3 at physiological levels increased the conversion of LC3-I to LC3-II and decreased the level of SQSTM1/p62. SKOv3-DIRAS3 cells were treated with DOX for the indicated intervals to induce DIRAS3 expression and then treated with CQ to block the function of autolysosomes. Band intensity was quantified using ImageJ. Data were obtained from 3 independent experiments. Values are the means ± SD (*P < 0.05; **P < 0.01).
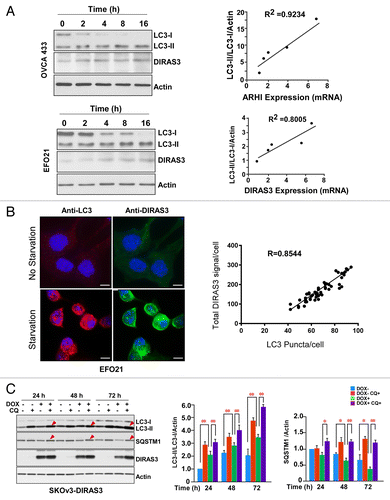
Figure 1. DIRAS3 expression is important for induction of autophagy. (A) Induction of DIRAS3 mRNA is correlated with increased conversion of LC3-I to LC3-II. OVCA433 and EFO21 ovarian cancer cells were incubated in growth medium or HBSS plus 0.3% glucose for 2, 4, 8, or 16 h. Cells were collected for western blotting with antibodies and RNA was extracted for analysis by real-time PCR analyses. Band intensities were quantified using ImageJ. (B) Increasing endogenous DIRAS3 protein is correlated with increasing LC3 puncta. EFO21 cells were incubated in growth medium or in HBSS plus 0.3% glucose for 4 h. Cells were stained for DIRAS3 or LC3 and imaged by immunofluorescence microscopy. The quantities of LC3 puncta and the intensities of endogenous DIRAS3 protein were quantified using ImageJ. Scale bars: 5 μm. (C) Re-expression of DIRAS3 at physiological levels increased the conversion of LC3-I to LC3-II and decreased the level of SQSTM1/p62. SKOv3-DIRAS3 cells were treated with DOX for the indicated intervals to induce DIRAS3 expression and then treated with CQ to block the function of autolysosomes. Band intensity was quantified using ImageJ. Data were obtained from 3 independent experiments. Values are the means ± SD (*P < 0.05; **P < 0.01).

Figure 2. DIRAS3 expression is required for induction of autophagy. (A) DIRAS3 depletion inhibits LC3 turnover. SKOv3-DIRAS3 cells in growth medium were transfected with siControl, siDIRAS3, siATG5 or siBECN1 for 48 h before incubation in growth medium or HBSS plus 0.3% glucose for 16 h. Cells were then treated with or without 400 nM bafilomycin A1 (BA) for 4 h. Cell lysates were subjected to western blotting. Band intensities were measured and analyzed for the relative accumulation of LC3-II/LC3-I. Data were obtained from 3 independent experiments. Values are the means ± SD (**P < 0.01). (B) DIRAS3 depletion inhibits accumulation of LC3 puncta. SKOv3-DIRAS3 cells were depleted of DIRAS3, ATG5 and BECN1 by siRNA transfection for 48 h before they were switched to growth medium or HBSS plus 0.3% glucose. Left panel, cells were stained for endogenous LC3 and imaged by immunofluorescence. Scale bars: 10 μm. Right panel, the expression of DIRAS3 and BECN1 knocked down with siRNA were analyzed by western blot.
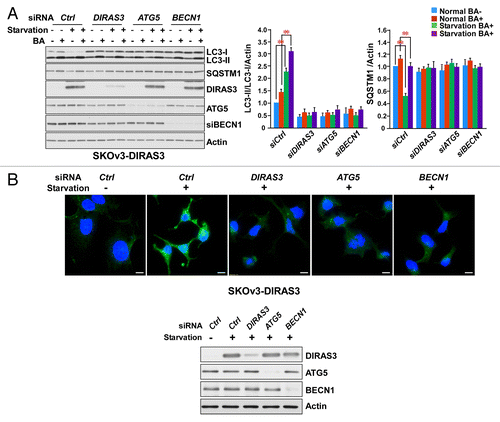
Figure 2. DIRAS3 expression is required for induction of autophagy. (A) DIRAS3 depletion inhibits LC3 turnover. SKOv3-DIRAS3 cells in growth medium were transfected with siControl, siDIRAS3, siATG5 or siBECN1 for 48 h before incubation in growth medium or HBSS plus 0.3% glucose for 16 h. Cells were then treated with or without 400 nM bafilomycin A1 (BA) for 4 h. Cell lysates were subjected to western blotting. Band intensities were measured and analyzed for the relative accumulation of LC3-II/LC3-I. Data were obtained from 3 independent experiments. Values are the means ± SD (**P < 0.01). (B) DIRAS3 depletion inhibits accumulation of LC3 puncta. SKOv3-DIRAS3 cells were depleted of DIRAS3, ATG5 and BECN1 by siRNA transfection for 48 h before they were switched to growth medium or HBSS plus 0.3% glucose. Left panel, cells were stained for endogenous LC3 and imaged by immunofluorescence. Scale bars: 10 μm. Right panel, the expression of DIRAS3 and BECN1 knocked down with siRNA were analyzed by western blot.

Figure 3. Expression of DIRAS3 induces colocalization of DIRAS3 with markers of autophagosomes. (A) DIRAS3 colocalizes with ATG12 and LC3 in SKOv3-DIRAS3 cells. SKOv3-DIRAS3 cells and SKOv3 cells were treated with DOX for 48 h. Immunofluorescence staining of DIRAS3 and endogenous ATG12 and LC3 was analyzed by confocal microscopy. Scale bars: 5 μm. Higher magnifications of indicated regions are shown. Scale bars: 1 µm. (B) DIRAS3 colocalizes with LC3. Representative immuno-gold electron microscopy images of induced and uninduced SKOv3-DIRAS3 cells are shown. The green arrows indicate DIRAS3 labeled with small gold particles in the autophagosome vesicles, and the red arrows indicate LC3 labeled with large gold particles. Scale bars: 0.2 μm. Higher magnification of an indicated region is shown. Scale bar: 1 µm. (C) DIRAS3 depletion inhibits accumulation of BECN1 and LC3 puncta, but not ULK1 puncta. SKOv3-DIRAS3 cells in growth medium were transfected with DIRAS3 siRNA 48 h before incubation in growth medium or amino acid starvation medium (HBSS + 3% glucose) for 16 h. Cells were stained for endogenous ULK1, BECN1, and ATG14 and imaged by immunofluorescence microscopy. Fluorescence intensity was quantified using ImageJ. Data were obtained from 3 independent experiments. Values are the means ± SD (**P < 0.01). Scale bars: 5 μm.
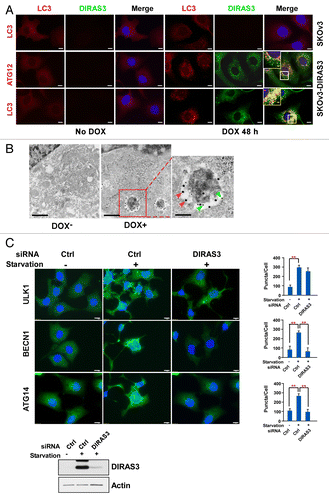
Figure 3. Expression of DIRAS3 induces colocalization of DIRAS3 with markers of autophagosomes. (A) DIRAS3 colocalizes with ATG12 and LC3 in SKOv3-DIRAS3 cells. SKOv3-DIRAS3 cells and SKOv3 cells were treated with DOX for 48 h. Immunofluorescence staining of DIRAS3 and endogenous ATG12 and LC3 was analyzed by confocal microscopy. Scale bars: 5 μm. Higher magnifications of indicated regions are shown. Scale bars: 1 µm. (B) DIRAS3 colocalizes with LC3. Representative immuno-gold electron microscopy images of induced and uninduced SKOv3-DIRAS3 cells are shown. The green arrows indicate DIRAS3 labeled with small gold particles in the autophagosome vesicles, and the red arrows indicate LC3 labeled with large gold particles. Scale bars: 0.2 μm. Higher magnification of an indicated region is shown. Scale bar: 1 µm. (C) DIRAS3 depletion inhibits accumulation of BECN1 and LC3 puncta, but not ULK1 puncta. SKOv3-DIRAS3 cells in growth medium were transfected with DIRAS3 siRNA 48 h before incubation in growth medium or amino acid starvation medium (HBSS + 3% glucose) for 16 h. Cells were stained for endogenous ULK1, BECN1, and ATG14 and imaged by immunofluorescence microscopy. Fluorescence intensity was quantified using ImageJ. Data were obtained from 3 independent experiments. Values are the means ± SD (**P < 0.01). Scale bars: 5 μm.

Figure 4. DIRAS3 colocalizes with BECN1 and co-immunoprecipitates with BECN1. (A) DIRAS3 colocalizes with BECN1. SKOv3-DIRAS3 cells were treated with DOX for 24 h. Immunofluorescent staining of expressed DIRAS3 and endogenous BECN1 was analyzed by confocal microscopy. Scale bars: 10 μm. (B) DIRAS3 colocalizes with BECN1. TEM images were obtained after staining with immunogold conjugates of anti-DIRAS3 (red arrow) and anti-BECN1 (green arrow) antibodies in SKOv3-DIRAS3 cells. Scale bars: 0.2 μm. Higher magnifications of indicated regions are shown. Scale bars: 1 µm. (C) DIRAS3 interacts with BECN1. SKOv3-DIRAS3 and Hey-DIRAS3 cells were treated with DOX. Endogenous DIRAS3-BECN1 complexes were immunoprecipitated with anti-BECN1 or anti-DIRAS3 and analyzed for co-immunoprecipitation of DIRAS3-BECN1 conjugates (IP). Host species-matched nonspecific IgG served as negative controls. Whole-cell lysates (WCL) are included for comparison. (D) Amino acid starvation enhances association of DIRAS3 with BECN1. CAOv3 cells were incubated in growth medium or amino-acid starvation medium for 16 h. BECN1-DIRAS3 complexes were immunoprecipitated with anti-DIRAS3 and analyzed for co-immunoprecipitated BECN1. (E) DIRAS3 interacts with BECN1 in vitro. Purified recombinant DIRAS3 and BECN1 proteins were incubated together to allow complex formation. The DIRAS3-BECN1 complexes that formed were immunoprecipitated with anti-BECN1 or anti-DIRAS3 antibodies and analyzed by western blotting.
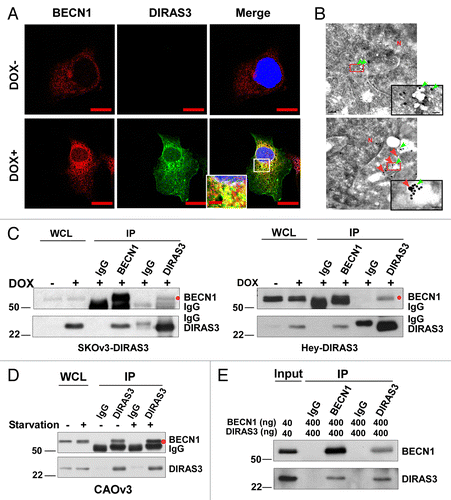
Figure 4. DIRAS3 colocalizes with BECN1 and co-immunoprecipitates with BECN1. (A) DIRAS3 colocalizes with BECN1. SKOv3-DIRAS3 cells were treated with DOX for 24 h. Immunofluorescent staining of expressed DIRAS3 and endogenous BECN1 was analyzed by confocal microscopy. Scale bars: 10 μm. (B) DIRAS3 colocalizes with BECN1. TEM images were obtained after staining with immunogold conjugates of anti-DIRAS3 (red arrow) and anti-BECN1 (green arrow) antibodies in SKOv3-DIRAS3 cells. Scale bars: 0.2 μm. Higher magnifications of indicated regions are shown. Scale bars: 1 µm. (C) DIRAS3 interacts with BECN1. SKOv3-DIRAS3 and Hey-DIRAS3 cells were treated with DOX. Endogenous DIRAS3-BECN1 complexes were immunoprecipitated with anti-BECN1 or anti-DIRAS3 and analyzed for co-immunoprecipitation of DIRAS3-BECN1 conjugates (IP). Host species-matched nonspecific IgG served as negative controls. Whole-cell lysates (WCL) are included for comparison. (D) Amino acid starvation enhances association of DIRAS3 with BECN1. CAOv3 cells were incubated in growth medium or amino-acid starvation medium for 16 h. BECN1-DIRAS3 complexes were immunoprecipitated with anti-DIRAS3 and analyzed for co-immunoprecipitated BECN1. (E) DIRAS3 interacts with BECN1 in vitro. Purified recombinant DIRAS3 and BECN1 proteins were incubated together to allow complex formation. The DIRAS3-BECN1 complexes that formed were immunoprecipitated with anti-BECN1 or anti-DIRAS3 antibodies and analyzed by western blotting.

Figure 5. DIRAS3 disrupts the BECN1-BCL2 complex by competing for BECN1 binding. (A and B) Expression of DIRAS3 inhibits BECN1 and BCL2 interaction in vivo. SKOv3-DIRAS3 cells and Hey-DIRAS3 cells were transfected with Flag-BCL2 followed by DOX treatment. The BECN1-BCL2 complex was immunoprecipitated with anti-BECN1 and analyzed for co-immunoprecipitation of BECN1-BCL2 interaction. (C) DIRAS3 depletion increases BECN1-BCL2 interaction. SKOv3-DIRAS3 cells were transfected with siDIRAS3 for 48 h to knock down DIRAS3 expression. The BECN1-BCL2 complex was immunoprecipitated with anti-BECN1 and analyzed with the indicated antibodies. (D) Expression of DIRAS3 inhibits BECN1 and BCL2 interaction in a time-dependent manner. SKOv3-DIRAS3 cells were treated with DOX for the indicated intervals. The BECN1-BCL2 complex was immunoprecipitated with anti-BECN1 and analyzed by western blot. (E) DIRAS3 protein competes with BCL2 for BECN1 binding. Increasing amounts of Flag-DIRAS3 (Coomassie Blue staining) was added to BECN1-BCL2 complex and BECN1-interacting proteins were immunoprecipitated with anti-BECN1 and analyzed by western blotting. (F) DIRAS3 is required for amino acid starvation-induced dissociation of BECN1 and BCL2. SKOv3-DIRAS3 cells were depleted of DIRAS3 by incubation with siRNA for 48 h before they were incubated in growth medium or in HBSS plus 0.3% glucose for 16 h. The BECN1-BCL2 and BECN1-DIRAS3 complexes were immunoprecipitated with anti-BECN1 and analyzed by western blotting. (C, siControl; A, siDIRAS3.)
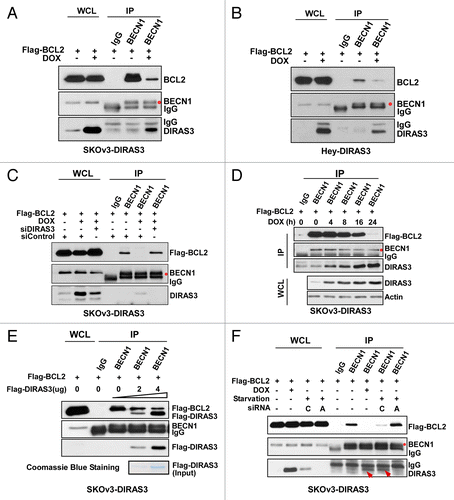
Figure 5. DIRAS3 disrupts the BECN1-BCL2 complex by competing for BECN1 binding. (A and B) Expression of DIRAS3 inhibits BECN1 and BCL2 interaction in vivo. SKOv3-DIRAS3 cells and Hey-DIRAS3 cells were transfected with Flag-BCL2 followed by DOX treatment. The BECN1-BCL2 complex was immunoprecipitated with anti-BECN1 and analyzed for co-immunoprecipitation of BECN1-BCL2 interaction. (C) DIRAS3 depletion increases BECN1-BCL2 interaction. SKOv3-DIRAS3 cells were transfected with siDIRAS3 for 48 h to knock down DIRAS3 expression. The BECN1-BCL2 complex was immunoprecipitated with anti-BECN1 and analyzed with the indicated antibodies. (D) Expression of DIRAS3 inhibits BECN1 and BCL2 interaction in a time-dependent manner. SKOv3-DIRAS3 cells were treated with DOX for the indicated intervals. The BECN1-BCL2 complex was immunoprecipitated with anti-BECN1 and analyzed by western blot. (E) DIRAS3 protein competes with BCL2 for BECN1 binding. Increasing amounts of Flag-DIRAS3 (Coomassie Blue staining) was added to BECN1-BCL2 complex and BECN1-interacting proteins were immunoprecipitated with anti-BECN1 and analyzed by western blotting. (F) DIRAS3 is required for amino acid starvation-induced dissociation of BECN1 and BCL2. SKOv3-DIRAS3 cells were depleted of DIRAS3 by incubation with siRNA for 48 h before they were incubated in growth medium or in HBSS plus 0.3% glucose for 16 h. The BECN1-BCL2 and BECN1-DIRAS3 complexes were immunoprecipitated with anti-BECN1 and analyzed by western blotting. (C, siControl; A, siDIRAS3.)

Figure 6. DIRAS3 inhibits BECN1 homo-dimerization. (A) DIRAS3 inhibits Flag-BECN1 and RFP-BECN1 dimerization. SKOv3-DIRAS3 cells were treated with DOX for 24 h and then transfected with Flag-BECN1 and RFP-BECN1 or RFP-Vector. Flag-BECN1-RFP-BECN1 or Flag-BECN1-RFP-Vector was immunoprecipitated with anti-Flag and analyzed by western blotting. (B) DIRAS3 inhibits Flag-BECN1 and endogenous BCL2 interaction. SKOv3-DIRAS3 cells were treated with DOX for 24 h, then transfected with Flag-BECN1. Flag-BECN1-BCL2 complexes were immunoprecipitated with anti-Flag and analyzed by western blotting. (C) DIRAS3 inhibits Flag-BECN1 and HA-BECN1 dimerization. SKOv3-DIRAS3 cells were treated with DOX for 24 h and then transfected with Flag-BECN1 and HA-BECN1. Cell lysates were subjected to LANCE TR-FRET protein-protein interaction analysis. Data were obtained from 2 independent experiments performed in triplicate. Values are the means ± SD (**P < 0.01). (D) BECN1 and DIRAS3 formed heterodimers in CAOv3 cells. BECN1 and DIRAS3 complexes were analyzed with an in situ PLA assay. Data were obtained from 2 independent experiments performed in triplicate. Values are the means ± SD (**P < 0.01). (E) BECN1 and DIRAS3 formed heterodimers in CAOv3 cells. BECN1 and DIRAS3 complexes were immunoprecipitated with anti-DIRAS3 and analyzed by western blotting.
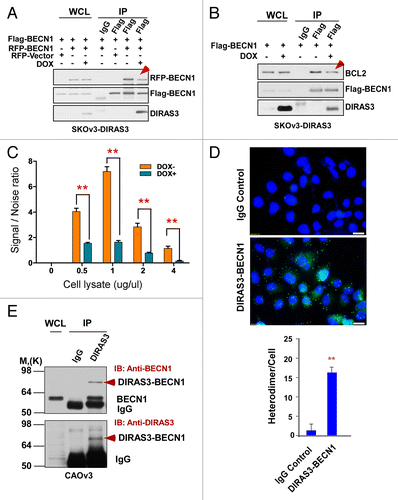
Figure 6. DIRAS3 inhibits BECN1 homo-dimerization. (A) DIRAS3 inhibits Flag-BECN1 and RFP-BECN1 dimerization. SKOv3-DIRAS3 cells were treated with DOX for 24 h and then transfected with Flag-BECN1 and RFP-BECN1 or RFP-Vector. Flag-BECN1-RFP-BECN1 or Flag-BECN1-RFP-Vector was immunoprecipitated with anti-Flag and analyzed by western blotting. (B) DIRAS3 inhibits Flag-BECN1 and endogenous BCL2 interaction. SKOv3-DIRAS3 cells were treated with DOX for 24 h, then transfected with Flag-BECN1. Flag-BECN1-BCL2 complexes were immunoprecipitated with anti-Flag and analyzed by western blotting. (C) DIRAS3 inhibits Flag-BECN1 and HA-BECN1 dimerization. SKOv3-DIRAS3 cells were treated with DOX for 24 h and then transfected with Flag-BECN1 and HA-BECN1. Cell lysates were subjected to LANCE TR-FRET protein-protein interaction analysis. Data were obtained from 2 independent experiments performed in triplicate. Values are the means ± SD (**P < 0.01). (D) BECN1 and DIRAS3 formed heterodimers in CAOv3 cells. BECN1 and DIRAS3 complexes were analyzed with an in situ PLA assay. Data were obtained from 2 independent experiments performed in triplicate. Values are the means ± SD (**P < 0.01). (E) BECN1 and DIRAS3 formed heterodimers in CAOv3 cells. BECN1 and DIRAS3 complexes were immunoprecipitated with anti-DIRAS3 and analyzed by western blotting.

Figure 7. The GTP-binding motif of DIRAS3 and N terminus of BECN1 are required for their interaction. (A) The central region of DIRAS3 is critical for interaction with BECN1. Myc-tagged wild type and mutant DIRAS3 were cotransfected with Flag-BECN1 into 293T cells. Interaction between Flag-BECN1 and each DIRAS3 mutant was analyzed by western blotting following immunoprecipitation with anti-Flag antibodies (BECN1), anti-Myc antibodies (DIRAS3) or control IgG and followed by western blotting with anti-Myc or anti-Flag as indicated. (B) BECN1 interacts preferentially with the active, GTP-bound DIRAS3. Wild type and DIRAS3 mutant Myc-M2(K93A G95Q) with point mutations that increased DIRAS3′s GTPase activity were cotransfected with Flag-BECN1 and their interaction analyzed by immunoprecipitation and western blotting. (C) The N-terminal region of BECN1 interacts with DIRAS3. Flag-tagged full-length and deletion mutants of BECN1 were cotransfected with Myc-DIRAS3. Interaction between Myc-DIRAS3 and each BECN1 mutant was analyzed by co-immunoprecipitation. The semiquantitative analysis of the DIRAS3-BECN1 interaction presented in was based on the ratio of anti-Myc (DIRAS3) relative to the amount of Flag-BECN1 that was affinity isolated with the anti-Flag antibody, and the anti-Flag (BECN1) ratio relative to the amount of Myc-DIRAS3 that was affinity isolated with the anti-Myc antibody.
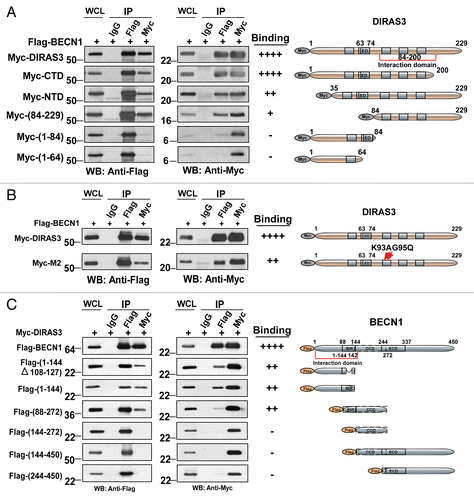
Figure 7. The GTP-binding motif of DIRAS3 and N terminus of BECN1 are required for their interaction. (A) The central region of DIRAS3 is critical for interaction with BECN1. Myc-tagged wild type and mutant DIRAS3 were cotransfected with Flag-BECN1 into 293T cells. Interaction between Flag-BECN1 and each DIRAS3 mutant was analyzed by western blotting following immunoprecipitation with anti-Flag antibodies (BECN1), anti-Myc antibodies (DIRAS3) or control IgG and followed by western blotting with anti-Myc or anti-Flag as indicated. (B) BECN1 interacts preferentially with the active, GTP-bound DIRAS3. Wild type and DIRAS3 mutant Myc-M2(K93A G95Q) with point mutations that increased DIRAS3′s GTPase activity were cotransfected with Flag-BECN1 and their interaction analyzed by immunoprecipitation and western blotting. (C) The N-terminal region of BECN1 interacts with DIRAS3. Flag-tagged full-length and deletion mutants of BECN1 were cotransfected with Myc-DIRAS3. Interaction between Myc-DIRAS3 and each BECN1 mutant was analyzed by co-immunoprecipitation. The semiquantitative analysis of the DIRAS3-BECN1 interaction presented in Figure 5A–C was based on the ratio of anti-Myc (DIRAS3) relative to the amount of Flag-BECN1 that was affinity isolated with the anti-Flag antibody, and the anti-Flag (BECN1) ratio relative to the amount of Myc-DIRAS3 that was affinity isolated with the anti-Myc antibody.

Figure 8. DIRAS3 induces autophagy dependent on its interaction with BECN1. (A and B) DIRAS3 mutants that fail to bind BECN1 cannot induce autophagy in SKOv3 and 293T cells. DIRAS3 and DIRAS3 deletion mutants were transfected into SKOv3 and 293T cells for 24 h. Induction of autophagy was examined by western blotting of LC3 and SQSTM1/p62. Band intensity was quantified using ImageJ. Data were obtained from 3 independent experiments. Values are the means ± SD (**P < 0.01). (C) DIRAS3 and CTD mutants can induce autophagy in SKOv3 cells. GFP-DIRAS3 and GFP-DIRAS3-mutants were cotransfected into SKOv3 cells with RFP-LC3 for 24 h. Cells were analyzed using confocal microscopy and RFP-LC3 puncta were counted. The puncta were quantified using ImageJ. Data were obtained from 3 independent experiments. Values are the means ± SD (**P < 0.01). Scale bars: 5 μm.
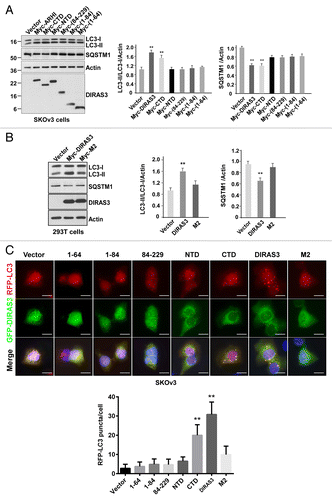
Figure 8. DIRAS3 induces autophagy dependent on its interaction with BECN1. (A and B) DIRAS3 mutants that fail to bind BECN1 cannot induce autophagy in SKOv3 and 293T cells. DIRAS3 and DIRAS3 deletion mutants were transfected into SKOv3 and 293T cells for 24 h. Induction of autophagy was examined by western blotting of LC3 and SQSTM1/p62. Band intensity was quantified using ImageJ. Data were obtained from 3 independent experiments. Values are the means ± SD (**P < 0.01). (C) DIRAS3 and CTD mutants can induce autophagy in SKOv3 cells. GFP-DIRAS3 and GFP-DIRAS3-mutants were cotransfected into SKOv3 cells with RFP-LC3 for 24 h. Cells were analyzed using confocal microscopy and RFP-LC3 puncta were counted. The puncta were quantified using ImageJ. Data were obtained from 3 independent experiments. Values are the means ± SD (**P < 0.01). Scale bars: 5 μm.

Figure 9. DIRAS3 is an integral component of the BECN1-PIK3C3-ATG14 multiprotein complex. (A) DIRAS3 is in the same complex with BECN1 and PIK3C3. 293T cells were transfected with Flag-BECN1, HA-PIK3C3, and Myc-DIRAS3 or Flag-Vector, HA-Vector and Myc-Vector for 24 h. Cell lysates were immunoprecipitated first with anti-Flag antibodies (BECN1), and the Flag peptide eluates were then immunoprecipitated with anti-HA or anti-Myc. The immunoprecipitates from the first and the second immunoprecipitations were analyzed by western blotting. (B) DIRAS3 is in the same complex with BECN1 and ATG14. Experiments were done as in (A), except HA-ATG14 was used in the co-transfection instead of HA-PIK3C3. (C) DIRAS3 is not in the same complex with BECN1 and UVRAG. Experiments were done as in (A), except HA-UVRAG was used in the co-transfection instead of HA-ATG4. (D) DIRAS3 interacts directly with PIK3C3. SKOv3-DIRAS3 cells were transfected by siBECN1 for 24 h followed by DOX treatment. The DIRAS3-PIK3C3 complex was immunoprecipitated with anti-DIRAS3 and analyzed by western blotting. (E) DIRAS3 interacts with ATG14 through BECN1. SKOv3-DIRAS3 cells were transfected with siBECN1 for 24 h followed by DOX treatment. The DIRAS3-ATG14 complex was immunoprecipitated with anti-DIRAS3 and analyzed by western blotting. (F and G) DIRAS3 increases interaction of BECN1 with ATG14 and PIK3C3. SKOv3-DIRAS3 cells were treated with or without DOX for 24 h. The BECN1-ATG14 or BECN1-PIK3C3 complexes were immunoprecipitated with anti-BECN1 and analyzed by western blotting.
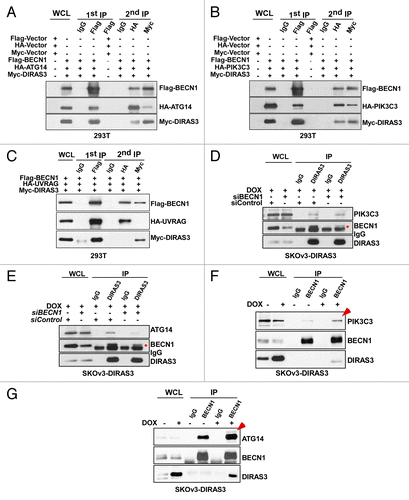
Figure 9. DIRAS3 is an integral component of the BECN1-PIK3C3-ATG14 multiprotein complex. (A) DIRAS3 is in the same complex with BECN1 and PIK3C3. 293T cells were transfected with Flag-BECN1, HA-PIK3C3, and Myc-DIRAS3 or Flag-Vector, HA-Vector and Myc-Vector for 24 h. Cell lysates were immunoprecipitated first with anti-Flag antibodies (BECN1), and the Flag peptide eluates were then immunoprecipitated with anti-HA or anti-Myc. The immunoprecipitates from the first and the second immunoprecipitations were analyzed by western blotting. (B) DIRAS3 is in the same complex with BECN1 and ATG14. Experiments were done as in (A), except HA-ATG14 was used in the co-transfection instead of HA-PIK3C3. (C) DIRAS3 is not in the same complex with BECN1 and UVRAG. Experiments were done as in (A), except HA-UVRAG was used in the co-transfection instead of HA-ATG4. (D) DIRAS3 interacts directly with PIK3C3. SKOv3-DIRAS3 cells were transfected by siBECN1 for 24 h followed by DOX treatment. The DIRAS3-PIK3C3 complex was immunoprecipitated with anti-DIRAS3 and analyzed by western blotting. (E) DIRAS3 interacts with ATG14 through BECN1. SKOv3-DIRAS3 cells were transfected with siBECN1 for 24 h followed by DOX treatment. The DIRAS3-ATG14 complex was immunoprecipitated with anti-DIRAS3 and analyzed by western blotting. (F and G) DIRAS3 increases interaction of BECN1 with ATG14 and PIK3C3. SKOv3-DIRAS3 cells were treated with or without DOX for 24 h. The BECN1-ATG14 or BECN1-PIK3C3 complexes were immunoprecipitated with anti-BECN1 and analyzed by western blotting.

Figure 10. DIRAS3 enhances BECN1-ATG14 and BECN1-PIK3C3 interaction and increases PIK3C3 kinase activity. (A) Amino acid starvation increases interaction of DIRAS3 with ATG14 and PIK3C3. SKOv3-DIRAS3 cells were incubated in growth medium and amino acid starvation medium for 16 h. The DIRAS3-ATG14 or DIRAS3-PIK3C3 complexes were immunoprecipitated with anti-DIRAS3 antibody and analyzed by western blotting. (B) Knockdown of DIRAS3 reduced interaction between BECN1 and ATG14 but not interaction between BECN1 and PIK3C3. SKOv3-DIRAS3 cells were transfected by siDIRAS3 for 24 h. The BECN1-ATG14 and BECN1-PIK3C3 complexes were immunoprecipitated with anti-BECN1 and analyzed by western blotting. (C) Expression of DIRAS3 increases PIK3C3 kinase activity. SKOV3-DIRAS3 cells were treated with DOX to induce DIRAS3 for 24 h. Left panel shows PIK3C3 protein was immunoprecipitated with anti-BECN1 antibody. Right panel shows kinase activity assay. The ADP-GloTM Kinase assay kit was used to measure the kinase activity of the PIK3C3 protein immunoprecipitated by anti-BECN1 antibody. Data were obtained from 2 independent experiments in triplicate. Values are the means ± SD (*P < 0.05). (D) Depletion of DIRAS3 reduced the accumulation of GFP-2X-FYVE puncta. SKOV3-DIRAS3 cells were transfected with siDIRAS3 for 24 h and then transfected with GFP-2x-FYVE for 24 h. GFP-2x-FYVE puncta were quantified using ImageJ. Scale bars: 10 μm. Data were obtained from 2 independent experiments in triplicate. Values are the means ± SD (*P < 0.05). (E) A working model of DIRAS3-dependent regulation of the autophagosome initiation complex.
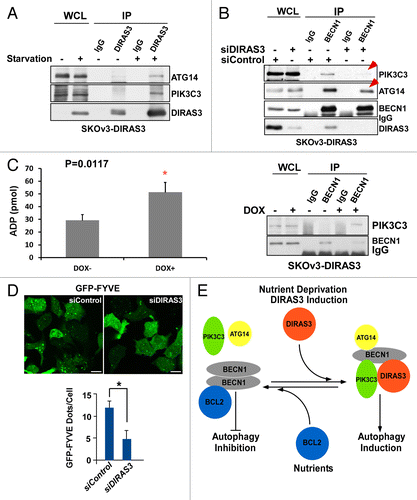
Figure 10. DIRAS3 enhances BECN1-ATG14 and BECN1-PIK3C3 interaction and increases PIK3C3 kinase activity. (A) Amino acid starvation increases interaction of DIRAS3 with ATG14 and PIK3C3. SKOv3-DIRAS3 cells were incubated in growth medium and amino acid starvation medium for 16 h. The DIRAS3-ATG14 or DIRAS3-PIK3C3 complexes were immunoprecipitated with anti-DIRAS3 antibody and analyzed by western blotting. (B) Knockdown of DIRAS3 reduced interaction between BECN1 and ATG14 but not interaction between BECN1 and PIK3C3. SKOv3-DIRAS3 cells were transfected by siDIRAS3 for 24 h. The BECN1-ATG14 and BECN1-PIK3C3 complexes were immunoprecipitated with anti-BECN1 and analyzed by western blotting. (C) Expression of DIRAS3 increases PIK3C3 kinase activity. SKOV3-DIRAS3 cells were treated with DOX to induce DIRAS3 for 24 h. Left panel shows PIK3C3 protein was immunoprecipitated with anti-BECN1 antibody. Right panel shows kinase activity assay. The ADP-GloTM Kinase assay kit was used to measure the kinase activity of the PIK3C3 protein immunoprecipitated by anti-BECN1 antibody. Data were obtained from 2 independent experiments in triplicate. Values are the means ± SD (*P < 0.05). (D) Depletion of DIRAS3 reduced the accumulation of GFP-2X-FYVE puncta. SKOV3-DIRAS3 cells were transfected with siDIRAS3 for 24 h and then transfected with GFP-2x-FYVE for 24 h. GFP-2x-FYVE puncta were quantified using ImageJ. Scale bars: 10 μm. Data were obtained from 2 independent experiments in triplicate. Values are the means ± SD (*P < 0.05). (E) A working model of DIRAS3-dependent regulation of the autophagosome initiation complex.

Figure 11. DIRAS3 expression associates with punctate LC3 and BECN1 staining in autophagosomes in ovarian cancers. (A) LC3 punctate staining is associated with robust DIRAS3 and BECN1 punctate staining in an ovarian cancer tissue microarray. Chi squared analysis was used to confirm the positive association between DIRAS3 and LC3 and BECN1 for punctate staining. (B) Representative tissue microarray images show different combinations of DIRAS3, BECN1 and LC3 expression in different ovarian cancers. Patient A: Positive for DIRAS3, BECN1, and LC3 with punctate staining. Lower magnification, scale bars: 25 μm. Higher magnification (inset), scale bars: 10 μm. The red arrows indicate the autophagosome vesicles. Patient B: Negative for DIRAS3, BECN1, and LC3. Patient C: Low DIRAS3 with only diffuse LC3 and BECN1 staining. Patient D: Low BECN1 with diffuse DIRAS3 and LC3 staining.
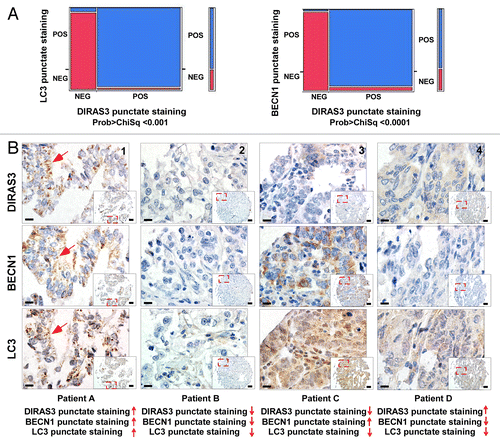
Figure 11. DIRAS3 expression associates with punctate LC3 and BECN1 staining in autophagosomes in ovarian cancers. (A) LC3 punctate staining is associated with robust DIRAS3 and BECN1 punctate staining in an ovarian cancer tissue microarray. Chi squared analysis was used to confirm the positive association between DIRAS3 and LC3 and BECN1 for punctate staining. (B) Representative tissue microarray images show different combinations of DIRAS3, BECN1 and LC3 expression in different ovarian cancers. Patient A: Positive for DIRAS3, BECN1, and LC3 with punctate staining. Lower magnification, scale bars: 25 μm. Higher magnification (inset), scale bars: 10 μm. The red arrows indicate the autophagosome vesicles. Patient B: Negative for DIRAS3, BECN1, and LC3. Patient C: Low DIRAS3 with only diffuse LC3 and BECN1 staining. Patient D: Low BECN1 with diffuse DIRAS3 and LC3 staining.

Figure 12. DIRAS3 expression associates with punctate LC3 and BECN1 staining in autophagosomes in ovarian cancer second-look samples. (A) Representative primary and second-look images stained with DIRAS3 and LC3. Lower magnification, scale bars: 10 μm. Higher magnification, scale bars: 5 μm. (B) Positive staining of the punctate DIRAS3 and LC3 is significantly higher in second-look than in primary cases. A bar graph of staining was generated by analysis of 34 pairs of primary and second-look ovarian cancer patient tissue samples. (C) DIRAS3 punctate staining correlates significantly with LC3 punctate staining. Contingency analysis of DIRAS3 puncta by LC3 puncta with Pearson Chi-square test (0: negative; 1: +; 2: ++; 3: +++).
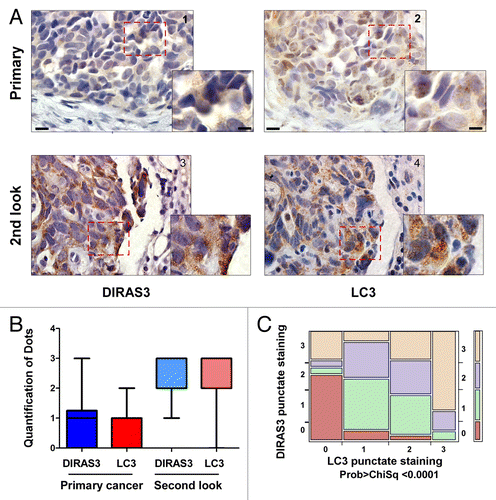
Figure 12. DIRAS3 expression associates with punctate LC3 and BECN1 staining in autophagosomes in ovarian cancer second-look samples. (A) Representative primary and second-look images stained with DIRAS3 and LC3. Lower magnification, scale bars: 10 μm. Higher magnification, scale bars: 5 μm. (B) Positive staining of the punctate DIRAS3 and LC3 is significantly higher in second-look than in primary cases. A bar graph of staining was generated by analysis of 34 pairs of primary and second-look ovarian cancer patient tissue samples. (C) DIRAS3 punctate staining correlates significantly with LC3 punctate staining. Contingency analysis of DIRAS3 puncta by LC3 puncta with Pearson Chi-square test (0: negative; 1: +; 2: ++; 3: +++).
Supplemental material

Additional material

Download Zip (1.4 MB)

Reprints and Corporate Permissions

Please note: Selecting permissions does not provide access to the full text of the article, please see our help page How do I view content?

To request a reprint or corporate permissions for this article, please click on the relevant link below:

Academic Permissions

Please note: Selecting permissions does not provide access to the full text of the article, please see our help page How do I view content?

Obtain permissions instantly via Rightslink by clicking on the button below:

If you are unable to obtain permissions via Rightslink, please complete and submit this Permissions form. For more information, please visit our Permissions help page.