3,275
Views
82
CrossRef citations to date
0
Altmetric
Translational Research Paper

Development of potent autophagy inhibitors that sensitize oncogenic BRAF V600E mutant melanoma tumor cells to vemurafenib

, , , , , , & show all
Pages 1120-1136 | Received 18 Jun 2013, Accepted 19 Mar 2014, Published online: 17 Apr 2014

Figures & data

Figure 1. Relative autophagy inhibition for each antimalarial compound. Seven known antimalarial agents were screened for the effective concentration (EC) at which they inhibit autophagy. Potency was determined by comparing the antimalarial EC to that of the EC of chloroquine.

Figure 1. Relative autophagy inhibition for each antimalarial compound. Seven known antimalarial agents were screened for the effective concentration (EC) at which they inhibit autophagy. Potency was determined by comparing the antimalarial EC to that of the EC of chloroquine.

Figure 2. Quinacrine inhibits autophagy more potently than chloroquine. (A) U2OS cells expressing tandem fluorescent LC3 (tfLC3) were treated for 3 h with chloroquine or quinacrine at the concentrations indicated, fixed, and imaged at 60× magnification. Green: GFP-LC3; Red: RFP-LC3, Blue: Hoechst (nuclei). Scale bars: 20 μm. Insets are 2× magnifications of boxed regions (scale bars: 5 μm). (B) Mean intensity of RFP-LC3-positive puncta was quantified using image analysis software following treatment with chloroquine (filled circles) or quinacrine (open circles) at the indicated concentrations (n ≥ 50 cells per condition). Error bars indicate standard deviation. Student 2-tailed t test: *P < 0.05; **P < 0.01; ***P < 0.001.
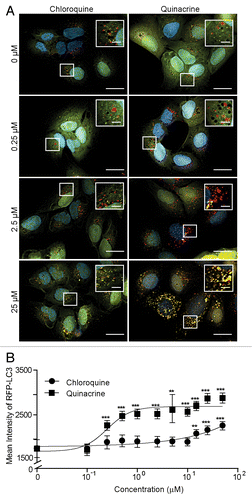
Figure 2. Quinacrine inhibits autophagy more potently than chloroquine. (A) U2OS cells expressing tandem fluorescent LC3 (tfLC3) were treated for 3 h with chloroquine or quinacrine at the concentrations indicated, fixed, and imaged at 60× magnification. Green: GFP-LC3; Red: RFP-LC3, Blue: Hoechst (nuclei). Scale bars: 20 μm. Insets are 2× magnifications of boxed regions (scale bars: 5 μm). (B) Mean intensity of RFP-LC3-positive puncta was quantified using image analysis software following treatment with chloroquine (filled circles) or quinacrine (open circles) at the indicated concentrations (n ≥ 50 cells per condition). Error bars indicate standard deviation. Student 2-tailed t test: *P < 0.05; **P < 0.01; ***P < 0.001.

Figure 3. Relative autophagy inhibition (EC), cytotoxicity (IC50), and chemical structure of novel autophagy compounds. The EC, IC50, and structures of the top compounds, VATG-027 and VATG-032, are shown in comparison to chloroquine and quinacrine

Figure 3. Relative autophagy inhibition (EC), cytotoxicity (IC50), and chemical structure of novel autophagy compounds. The EC, IC50, and structures of the top compounds, VATG-027 and VATG-032, are shown in comparison to chloroquine and quinacrine

Figure 4. VATG-027 and VATG-032 show greater autophagy inhibition than chloroquine. (A) U2OS-tfLC3 cells were treated for 3 h with chloroquine, VATG-027, or VATG-032 at the indicated concentrations, fixed, and imaged at 60× magnification. Green: GFP-LC3; Red: RFP-LC3; Blue: Hoechst (nuclei). Scale bars: 20 μm. Insets are 2.5× magnifications of boxed regions (scale bars: 8 μm). (B) Mean pixel intensity of RFP-LC3 (red) puncta over a dose response with chloroquine (filled circles, solid line), quinacrine (open circles, solid line), VATG-027 (closed triangles, dashed line), and VATG-032 (open triangles, dashed line). Error bars indicate standard deviation. (C) Relative cell viability (as a percent of DMSO control) determined 48 h after treatment with chloroquine, quinacrine, VATG-027 or VATG-032. Error bars indicate standard deviation. Circles indicate 3 μM concentrations and colors correlate with treatment colors in (D). (D) FACS analysis of cleaved CASP3 after treatment with 3 μM chloroquine, quinacrine, VATG-027, and VATG-032.
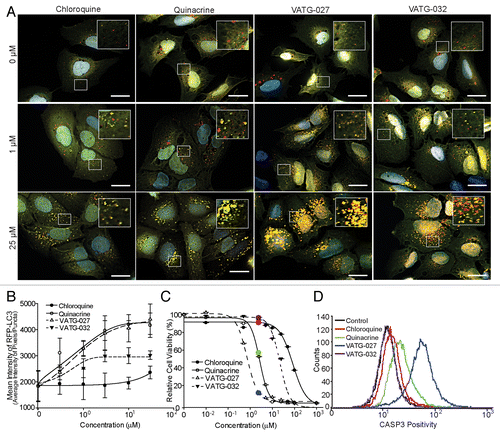
Figure 4. VATG-027 and VATG-032 show greater autophagy inhibition than chloroquine. (A) U2OS-tfLC3 cells were treated for 3 h with chloroquine, VATG-027, or VATG-032 at the indicated concentrations, fixed, and imaged at 60× magnification. Green: GFP-LC3; Red: RFP-LC3; Blue: Hoechst (nuclei). Scale bars: 20 μm. Insets are 2.5× magnifications of boxed regions (scale bars: 8 μm). (B) Mean pixel intensity of RFP-LC3 (red) puncta over a dose response with chloroquine (filled circles, solid line), quinacrine (open circles, solid line), VATG-027 (closed triangles, dashed line), and VATG-032 (open triangles, dashed line). Error bars indicate standard deviation. (C) Relative cell viability (as a percent of DMSO control) determined 48 h after treatment with chloroquine, quinacrine, VATG-027 or VATG-032. Error bars indicate standard deviation. Circles indicate 3 μM concentrations and colors correlate with treatment colors in (D). (D) FACS analysis of cleaved CASP3 after treatment with 3 μM chloroquine, quinacrine, VATG-027, and VATG-032.

Figure 5. Autophagy inhibitors decrease lysosomal pH and impair lysosomal turnover. (A) U2OS cells were treated for 3 h with vehicle control or 3 μM autophagy inhibitor (chloroquine, quinacrine, VATG-027, or VATG-032). Cells were stained with 100 nM LysoTracker Red for 1 h prior to fixation. Cells were stained with endogenous LAMP1 antibodies and fluorescently conjugated secondary antibodies (green), Hoechst (nuclei; blue), and imaged at 60× magnification. Scale bars: 20 μm. Upper right insets are red and green channels separated and magnified 1.5× from boxed regions. (B) Red and green channel intensity plots were generated using image analysis software and displayed on the z axis (peaks) of a 3D representation of the images from (A). (C) Quantification of colocalized LAMP1 and LysoTracker Red as described in Materials and Methods. Student 2-tailed t test: **P < 0.01; ***P < 0.001 and Mander colocalization coefficient (MCC).
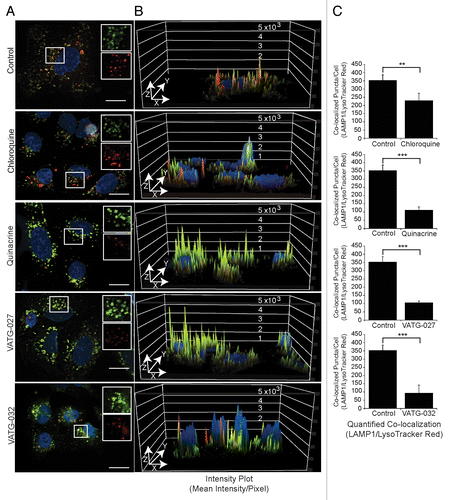
Figure 5. Autophagy inhibitors decrease lysosomal pH and impair lysosomal turnover. (A) U2OS cells were treated for 3 h with vehicle control or 3 μM autophagy inhibitor (chloroquine, quinacrine, VATG-027, or VATG-032). Cells were stained with 100 nM LysoTracker Red for 1 h prior to fixation. Cells were stained with endogenous LAMP1 antibodies and fluorescently conjugated secondary antibodies (green), Hoechst (nuclei; blue), and imaged at 60× magnification. Scale bars: 20 μm. Upper right insets are red and green channels separated and magnified 1.5× from boxed regions. (B) Red and green channel intensity plots were generated using image analysis software and displayed on the z axis (peaks) of a 3D representation of the images from (A). (C) Quantification of colocalized LAMP1 and LysoTracker Red as described in Materials and Methods. Student 2-tailed t test: **P < 0.01; ***P < 0.001 and Mander colocalization coefficient (MCC).

Figure 6. Autophagy inhibitors inactivate lysosomes and cause accumulation of cytosolic vesicles. (A) U2OS cells were treated for 3 h with a vehicle control or 100 μM chloroquine, fixed, and analyzed by transmission electron microscopy (TEM). Accumulation in both size and number of electron dense and lucent vesicles, consistent with lysosomes and endosomes (black arrows), is observed following chloroquine treatment. Scale bars: 2 μm. Right panels are magnifications of the boxed regions (scale bars: 1.14 μm and 500 nm, respectively). (B) U2OS cells were treated for 3 h with 3 μM chloroquine, quinacrine, VATG-027, or VATG-032, fixed, and analyzed by TEM. Electron-dense and electron-lucent vesicles are indicated with black arrows. Scale bars: 2 μm (left images). Right panels are magnified images of the boxed regions indicated by number (panel 1 scale bars: 1.2 μm; panel 2 scale bars: 500 nm). (C) Mean vesicle number per cell for treatments shown in B (20 images per treatment). Error bars indicate standard deviation. Student 2-tailed t test to control or chloroquine treatment as indicated: **P < 0.01; ***P < 0.001. (D) Immunoblot of U2OS cells treated with 3 μM and 30 μM of chloroquine, quinacrine, VATG-027, and VATG-032 for 6 h. Cell lysates were probed for pro and active forms of CTSB (pro and active forms indicated). Tubulin was included as a loading control.

Figure 6. Autophagy inhibitors inactivate lysosomes and cause accumulation of cytosolic vesicles. (A) U2OS cells were treated for 3 h with a vehicle control or 100 μM chloroquine, fixed, and analyzed by transmission electron microscopy (TEM). Accumulation in both size and number of electron dense and lucent vesicles, consistent with lysosomes and endosomes (black arrows), is observed following chloroquine treatment. Scale bars: 2 μm. Right panels are magnifications of the boxed regions (scale bars: 1.14 μm and 500 nm, respectively). (B) U2OS cells were treated for 3 h with 3 μM chloroquine, quinacrine, VATG-027, or VATG-032, fixed, and analyzed by TEM. Electron-dense and electron-lucent vesicles are indicated with black arrows. Scale bars: 2 μm (left images). Right panels are magnified images of the boxed regions indicated by number (panel 1 scale bars: 1.2 μm; panel 2 scale bars: 500 nm). (C) Mean vesicle number per cell for treatments shown in B (20 images per treatment). Error bars indicate standard deviation. Student 2-tailed t test to control or chloroquine treatment as indicated: **P < 0.01; ***P < 0.001. (D) Immunoblot of U2OS cells treated with 3 μM and 30 μM of chloroquine, quinacrine, VATG-027, and VATG-032 for 6 h. Cell lysates were probed for pro and active forms of CTSB (pro and active forms indicated). Tubulin was included as a loading control.

Figure 7. Melanoma cell lines have active basal autophagy. (A) Nine patient-derived melanoma cell lines were treated with 50 μM CQ for 0, 1, or 3 h. Cell lysates were probed by immunoblotting for endogenous LC3B (LC3B-I: cytosolic; LC3B-II: membrane-bound). (B) The levels of LC3B-II and tubulin α were measured using quantitative infrared imaging system (Odyssey) and immunoblotting. The fold change was determined by the change in LC3B-II normalized to tubulin α (LC3-II/tubulin α) from 0 to 3 h (y axis). Error bars indicate standard deviation. Student 2-tailed t test: *P < 0.05; **P < 0.01 compared with UACC2534 cells. Mutational status of BRAF and HRAS is indicated as mutant by (+) and wild type by (−).

Figure 7. Melanoma cell lines have active basal autophagy. (A) Nine patient-derived melanoma cell lines were treated with 50 μM CQ for 0, 1, or 3 h. Cell lysates were probed by immunoblotting for endogenous LC3B (LC3B-I: cytosolic; LC3B-II: membrane-bound). (B) The levels of LC3B-II and tubulin α were measured using quantitative infrared imaging system (Odyssey) and immunoblotting. The fold change was determined by the change in LC3B-II normalized to tubulin α (LC3-II/tubulin α) from 0 to 3 h (y axis). Error bars indicate standard deviation. Student 2-tailed t test: *P < 0.05; **P < 0.01 compared with UACC2534 cells. Mutational status of BRAF and HRAS is indicated as mutant by (+) and wild type by (−).

Figure 8. The BRAF V600E inhibitor, PLX-4032, does not alter autophagic flux. (A) A375 cell viability was determined after 48 h treatment with CQ (filled circles), QN (open circles), VATG-027 (filled triangles), VATG-032 (open triangles), or PLX-4032 (filled squares). (B) Immunoblot of A375 cells treated with 0 μM, 10 nM, 100 nM, and 1000 nM of PLX-4032 in the presence (+) or absence (−) of CQ (50 μM). Cell lysates were probed for total MAPK1/3, phospho-MAPK1/3, and LC3B (LC3B-I, cytosolic; LC3B-II, membrane-bound). Tubulin was included as a loading control. (C) Soft agar colony formation assays using A375 cells treated every other day for 3 wk with 3 μM of CQ, QN, VATG-032, and 1 μM VATG-027 in the presence or absence of PLX-4032 (400 nM). Colonies were stained with crystal violet and quantified using image analysis software. Three replicates were averaged and standard deviation indicated by error bars. Student 2-tailed t test: *P < 0.05, **P < 0.01, and ***P < 0.001.

Figure 8. The BRAF V600E inhibitor, PLX-4032, does not alter autophagic flux. (A) A375 cell viability was determined after 48 h treatment with CQ (filled circles), QN (open circles), VATG-027 (filled triangles), VATG-032 (open triangles), or PLX-4032 (filled squares). (B) Immunoblot of A375 cells treated with 0 μM, 10 nM, 100 nM, and 1000 nM of PLX-4032 in the presence (+) or absence (−) of CQ (50 μM). Cell lysates were probed for total MAPK1/3, phospho-MAPK1/3, and LC3B (LC3B-I, cytosolic; LC3B-II, membrane-bound). Tubulin was included as a loading control. (C) Soft agar colony formation assays using A375 cells treated every other day for 3 wk with 3 μM of CQ, QN, VATG-032, and 1 μM VATG-027 in the presence or absence of PLX-4032 (400 nM). Colonies were stained with crystal violet and quantified using image analysis software. Three replicates were averaged and standard deviation indicated by error bars. Student 2-tailed t test: *P < 0.05, **P < 0.01, and ***P < 0.001.

Figure 9. Autophagy inhibitors reduce A375 colony formation alone and in combination with PLX-4032. (A) A375 cells were grown in soft agar and treated every other day for 3 wk with the IC10 concentration of PLX-4032 (1.3 nM) in the presence or absence of the IC10 concentration for chloroquine (CQ; 274 nM), quinacrine (QN; 64 nM), VATG-027 (5 nM), or VATG-032 (2 nM). Colonies were stained with crystal violet and quantified using image analysis software. Colony numbers from 3 independent experiments were averaged and standard deviation indicated by error bars. Student 2-tailed t test: Significant *P < 0.05, **P < 0.01, and ***P < 0.001. (B) The percent change in response (colony reduction) exceeding the expected additive effect as determined by the Bliss Independence Model was determined for each autophagy inhibitor in combination with PLX-4032. Error bars represent standard deviation.

Figure 9. Autophagy inhibitors reduce A375 colony formation alone and in combination with PLX-4032. (A) A375 cells were grown in soft agar and treated every other day for 3 wk with the IC10 concentration of PLX-4032 (1.3 nM) in the presence or absence of the IC10 concentration for chloroquine (CQ; 274 nM), quinacrine (QN; 64 nM), VATG-027 (5 nM), or VATG-032 (2 nM). Colonies were stained with crystal violet and quantified using image analysis software. Colony numbers from 3 independent experiments were averaged and standard deviation indicated by error bars. Student 2-tailed t test: Significant *P < 0.05, **P < 0.01, and ***P < 0.001. (B) The percent change in response (colony reduction) exceeding the expected additive effect as determined by the Bliss Independence Model was determined for each autophagy inhibitor in combination with PLX-4032. Error bars represent standard deviation.
Supplemental material

Additional material

Download Zip (2.6 MB)