2,861
Views
87
CrossRef citations to date
0
Altmetric
Basic Research Paper

Suppression of MAPK/JNK-MTORC1 signaling leads to premature loss of organelles and nuclei by autophagy during terminal differentiation of lens fiber cells

, , , &
Pages 1193-1211 | Received 21 Jun 2013, Accepted 03 Apr 2014, Published online: 09 May 2014

Figures & data

Figure 1. Temporal loss of organelles and nuclei in the embryonic chick lens. (A–D) Immunoblot and immunostaining analysis for presence of the ER marker HSPA5/Bip and the Golgi marker FTCD in chick embryo lenses at E13 (A and B) and E15 (C and D). (A–D) Immunostaining of mid-sagittal lens cryosections for ER (HSPA5; A and C, red) and Golgi (FTCD; B and D, red), colabeled with the nuclear dye TO-PRO-3 (blue). Images were obtained by confocal microscopy. Low magnification images in the left panels represent projections of acquired z-stacks; scale bar, 500 μm. Boxed areas are shown at higher magnification to the right, each a 1-μm optical slice selected from an acquired z-stack; scale bar, 20 μm. Nuclei are from the same field as the ER or Golgi marker at their left. Organelle markers are designated as (i), nuclear marker as (ii). Immunoblots with accompanying densitometric analyses for HSPA5 (A and C) and FTCD (B and D) was performed on microdissected fractions of the cortical lens fiber cell zone (FP) and the central lens fiber cell zone (FC), quantification is presented as a ratio to GAPDH. Both immunostaining and immunoblotting results show that significant loss of ER and Golgi had occurred between E13 and E15. The remaining organelles in the FC zone at E15 had a vesicular presentation suggesting that they are being degraded. With the same temporal sequence as organelle loss nuclei become highly pyknotic and began to disappear. All of these processes occur in the central region of the lens where lens fiber cells mature and the organelle-free zone is established. These data are representative of at least 3 independent studies. Error bars represent SE. See Figure S1 for immunostaining of the ER protein CALR3 at E15.
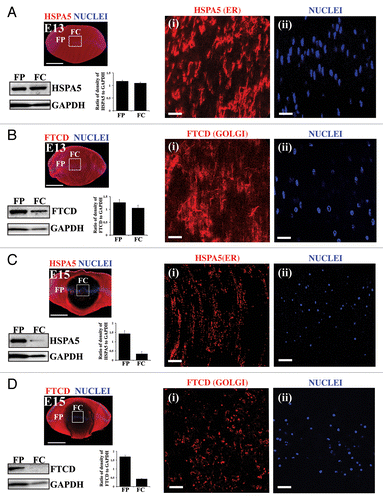
Figure 1. Temporal loss of organelles and nuclei in the embryonic chick lens. (A–D) Immunoblot and immunostaining analysis for presence of the ER marker HSPA5/Bip and the Golgi marker FTCD in chick embryo lenses at E13 (A and B) and E15 (C and D). (A–D) Immunostaining of mid-sagittal lens cryosections for ER (HSPA5; A and C, red) and Golgi (FTCD; B and D, red), colabeled with the nuclear dye TO-PRO-3 (blue). Images were obtained by confocal microscopy. Low magnification images in the left panels represent projections of acquired z-stacks; scale bar, 500 μm. Boxed areas are shown at higher magnification to the right, each a 1-μm optical slice selected from an acquired z-stack; scale bar, 20 μm. Nuclei are from the same field as the ER or Golgi marker at their left. Organelle markers are designated as (i), nuclear marker as (ii). Immunoblots with accompanying densitometric analyses for HSPA5 (A and C) and FTCD (B and D) was performed on microdissected fractions of the cortical lens fiber cell zone (FP) and the central lens fiber cell zone (FC), quantification is presented as a ratio to GAPDH. Both immunostaining and immunoblotting results show that significant loss of ER and Golgi had occurred between E13 and E15. The remaining organelles in the FC zone at E15 had a vesicular presentation suggesting that they are being degraded. With the same temporal sequence as organelle loss nuclei become highly pyknotic and began to disappear. All of these processes occur in the central region of the lens where lens fiber cells mature and the organelle-free zone is established. These data are representative of at least 3 independent studies. Error bars represent SE. See Figure S1 for immunostaining of the ER protein CALR3 at E15.

Figure 2. Active autophagy is involved in the removal of nuclei and organelles from the lens fiber cells in the E15 chick lens. (A and B) E15 lens cryosections were immunostained for the autophagy markers LC3B (A, red) and BECN1/Beclin 1 (B, red) and colabeled with the nuclear dye TO-PRO-3 (blue). Images were acquired by confocal microscopy. Images shown in the left panel of (A and B) are low magnification images represented as projections of acquired z-stacks; scale bar, 200 μm. Boxed areas are shown at higher magnification to the right, each a 1-μm optical slice selected from an acquired z-stack; scale bar, 20 μm. The cortical lens fiber cell region (FP) is designated as (i) and the central lens fiber cell region (FC) as (ii), diagrammed in the model in (C). The results show that the intensity and staining pattern of autophagy markers LC3B and BECN1 in the E15 lens is differentiation-state specific, with a vesicular appearance in the FC zone. (C) Cryosections of E15 lenses were co-immunostained either for (i and ii) LC3B (red), CALR3 (ER marker, green), and TO-PRO-3 (nuclear dye, blue) or for (iii) BECN1 (red) and CALR3 (ER marker, green) and imaged in the (i) FP and (ii) FC zones. Boxed (red), regions on the model designate areas from where images were acquired. Images are each a 1-μm optical slice selected from an acquired z-stack; scale bar, 20 μm. Confocal images are representative of 3 independent studies. In the FC zone, both LC3B and BECN1, which localize to autophagic vesicles, showed significant overlap with the ER marker CALR3, suggesting the removal of organelles during lens development occurs through an autophagic process. See also Figures S2–S4. (D) Immunoblot studies showing expression levels of SQSTM1/p62 in differentiation-specific fractions isolated by microdissection from E15 lenses. EC, undifferentiated lens epithelial cells; EQ, equatorial epithelium, the zone of differentiation initiation; FP, cortical fiber cells, a region of lens morphogenesis; and FC, central fiber cells, the region of fiber cell maturation. Quantification of SQSTM1 expression relative to GAPDH is shown in the panel on the right. Data represent 3 independent studies. This result supported the conclusion that autophagy is occurring in lens fiber cells as the loss of SQSTM1 is correlated with active autophagy. Error bars represent S.E., **P ≤ 0.01, t test. n.s., nonsignificant. See Figure S5 for immunolocalization of SQSTM1 at E15. (E, i and ii) Electron micrographs showing double-membrane-bound autophagosomes surrounding a degrading organelle that is likely a mitochondria and cytoplasmic debris in the cortical fiber cell zone close to the region of organelle loss. Boxed insets in (i and ii) are shown at higher magnification to the right. Data show structural evidence of autophagy in the region in which organelles are lost during lens development; scale bar, 500 nm. Results are representative of 4 independent studies.
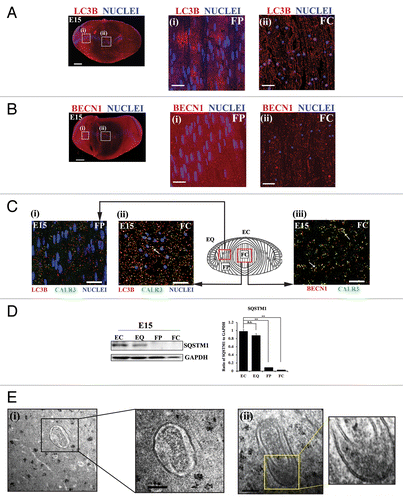
Figure 2. Active autophagy is involved in the removal of nuclei and organelles from the lens fiber cells in the E15 chick lens. (A and B) E15 lens cryosections were immunostained for the autophagy markers LC3B (A, red) and BECN1/Beclin 1 (B, red) and colabeled with the nuclear dye TO-PRO-3 (blue). Images were acquired by confocal microscopy. Images shown in the left panel of (A and B) are low magnification images represented as projections of acquired z-stacks; scale bar, 200 μm. Boxed areas are shown at higher magnification to the right, each a 1-μm optical slice selected from an acquired z-stack; scale bar, 20 μm. The cortical lens fiber cell region (FP) is designated as (i) and the central lens fiber cell region (FC) as (ii), diagrammed in the model in (C). The results show that the intensity and staining pattern of autophagy markers LC3B and BECN1 in the E15 lens is differentiation-state specific, with a vesicular appearance in the FC zone. (C) Cryosections of E15 lenses were co-immunostained either for (i and ii) LC3B (red), CALR3 (ER marker, green), and TO-PRO-3 (nuclear dye, blue) or for (iii) BECN1 (red) and CALR3 (ER marker, green) and imaged in the (i) FP and (ii) FC zones. Boxed (red), regions on the model designate areas from where images were acquired. Images are each a 1-μm optical slice selected from an acquired z-stack; scale bar, 20 μm. Confocal images are representative of 3 independent studies. In the FC zone, both LC3B and BECN1, which localize to autophagic vesicles, showed significant overlap with the ER marker CALR3, suggesting the removal of organelles during lens development occurs through an autophagic process. See also Figures S2–S4. (D) Immunoblot studies showing expression levels of SQSTM1/p62 in differentiation-specific fractions isolated by microdissection from E15 lenses. EC, undifferentiated lens epithelial cells; EQ, equatorial epithelium, the zone of differentiation initiation; FP, cortical fiber cells, a region of lens morphogenesis; and FC, central fiber cells, the region of fiber cell maturation. Quantification of SQSTM1 expression relative to GAPDH is shown in the panel on the right. Data represent 3 independent studies. This result supported the conclusion that autophagy is occurring in lens fiber cells as the loss of SQSTM1 is correlated with active autophagy. Error bars represent S.E., **P ≤ 0.01, t test. n.s., nonsignificant. See Figure S5 for immunolocalization of SQSTM1 at E15. (E, i and ii) Electron micrographs showing double-membrane-bound autophagosomes surrounding a degrading organelle that is likely a mitochondria and cytoplasmic debris in the cortical fiber cell zone close to the region of organelle loss. Boxed insets in (i and ii) are shown at higher magnification to the right. Data show structural evidence of autophagy in the region in which organelles are lost during lens development; scale bar, 500 nm. Results are representative of 4 independent studies.

Figure 3. Temporal inactivation of MAPK/JNK in chick embryonic lenses. (A and B) Immunostaining (i and ii) and immunoblotting analysis (iii and iv) of lens cryosections for phospho-(p)-JUN Ser63/73, the direct downstream target of MAPK/JNK, at (A) E13 and (B) E15 are shown. Boxed region in (i) is represented at high magnification in (ii). (i and ii) Images were acquired by confocal microscopy. Analysis of p-JUN expression in E13 (A) and E15 (B) lenses by immunoblotting is shown in (iii), to its right, densitometric analysis of p-JUN expression ratio adjusted to the loading control GAPDH is shown (iv). Error bars represent SE. Results indicate presence of active MAPK/JNK signaling in the central lens fiber cells at E13 and inhibition of the MAPK/JNK signal in this region of the lens at E15, coincident with loss of nuclei and organelles to form the OFZ, suggesting that inactivation of MAPK/JNK may be involved in this process. Images in (i) are projection images of acquired z-stacks, (ii) is a 1-μm thick optical slice. Scale bar, 200 μm (i) and 20 μm (ii). Results are representative of 3 independent studies.
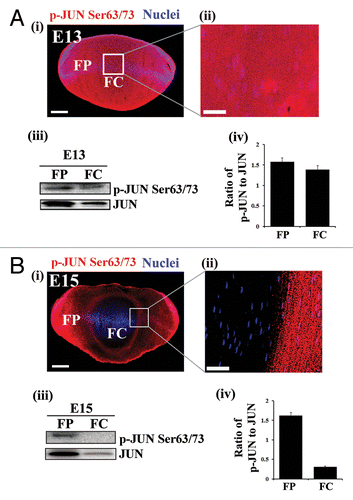
Figure 3. Temporal inactivation of MAPK/JNK in chick embryonic lenses. (A and B) Immunostaining (i and ii) and immunoblotting analysis (iii and iv) of lens cryosections for phospho-(p)-JUN Ser63/73, the direct downstream target of MAPK/JNK, at (A) E13 and (B) E15 are shown. Boxed region in (i) is represented at high magnification in (ii). (i and ii) Images were acquired by confocal microscopy. Analysis of p-JUN expression in E13 (A) and E15 (B) lenses by immunoblotting is shown in (iii), to its right, densitometric analysis of p-JUN expression ratio adjusted to the loading control GAPDH is shown (iv). Error bars represent SE. Results indicate presence of active MAPK/JNK signaling in the central lens fiber cells at E13 and inhibition of the MAPK/JNK signal in this region of the lens at E15, coincident with loss of nuclei and organelles to form the OFZ, suggesting that inactivation of MAPK/JNK may be involved in this process. Images in (i) are projection images of acquired z-stacks, (ii) is a 1-μm thick optical slice. Scale bar, 200 μm (i) and 20 μm (ii). Results are representative of 3 independent studies.

Figure 4. MAPK/JNK inactivation induces premature loss of ER and nuclei from the central lens fiber cells. (A and B, i–iv) Mid-sagittal lens cryosections from whole lens organ cultures, exposed to the vehicle, DMSO, and the MAPK/JNK inhibitor, SP600125, for 24 h, were immunostained for the ER markers HSPA5/Bip (A, i–iv, red), or CALR3 (B, i–iv, green), and colabeled with the nuclear dye TO-PRO-3 (A and B, i–iv, blue). Low magnification confocal images (i and ii) in (A and B) represent projection images of optical slice of 8-μm thickness; scale bar, 200 μm. Boxed areas in (A and B, i and ii) are shown at higher magnification below (iii and iv). Optical slices of 1-μm thickness were selected from an acquired z-stack; scale bar, 20 μm. Data show premature loss of ER in central lens fiber cells is induced when MAPK/JNK activation is suppressed. (A and B, v and vi) Immunoblot studies show that expression of the ER markers (A, v) HSPA5 and (B, v) CALR3 were significantly decreased in the central lens fiber cells (FC) after a 24 h exposure to the MAPK/JNK inhibitor SP00125. Quantification of HSPA5 and CALR3 expression is shown in (A, vi) and (B, vi), respectively. See Figure S7 for immunoblot and immunolocalization results for HSPA5 expression following exposure to the MAPK/JNK inhibitor JNK-IN-8. (C and D) Mid-sagittal lens cryosections obtained from whole lenses that were exposed to the vehicle DMSO, or MAPK/JNK inhibitor, SP600125, for 24 h (C) and 48 h (D) were fixed and labeled with TO-PRO-3 to detect nuclei. Low magnification confocal images (i and ii) in (C and D) represent projections of acquired z-stacks; scale bar, 200 μm. Boxed areas in (i and ii) are shown at higher magnification below (iii and iv). These images were 1-μm optical slices selected from an acquired z-stack; scale bar, 20 μm. Results show pyknosis of nuclei is induced prematurely when MAPK/JNK activation was suppressed for 24 h, followed by nuclear loss after 48 h. See also Figure S8. Results are representative of at least 3 or more independent studies. Error bars represent S.E., */#P ≤ 0.05, t test.
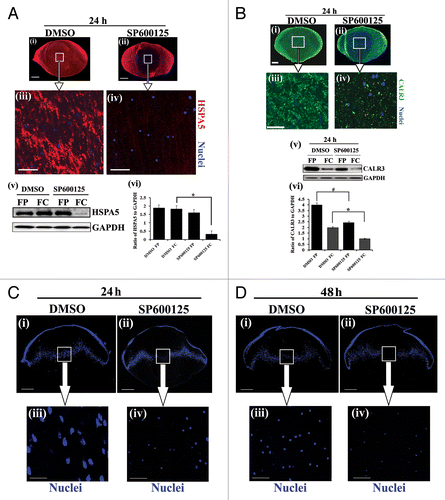
Figure 4. MAPK/JNK inactivation induces premature loss of ER and nuclei from the central lens fiber cells. (A and B, i–iv) Mid-sagittal lens cryosections from whole lens organ cultures, exposed to the vehicle, DMSO, and the MAPK/JNK inhibitor, SP600125, for 24 h, were immunostained for the ER markers HSPA5/Bip (A, i–iv, red), or CALR3 (B, i–iv, green), and colabeled with the nuclear dye TO-PRO-3 (A and B, i–iv, blue). Low magnification confocal images (i and ii) in (A and B) represent projection images of optical slice of 8-μm thickness; scale bar, 200 μm. Boxed areas in (A and B, i and ii) are shown at higher magnification below (iii and iv). Optical slices of 1-μm thickness were selected from an acquired z-stack; scale bar, 20 μm. Data show premature loss of ER in central lens fiber cells is induced when MAPK/JNK activation is suppressed. (A and B, v and vi) Immunoblot studies show that expression of the ER markers (A, v) HSPA5 and (B, v) CALR3 were significantly decreased in the central lens fiber cells (FC) after a 24 h exposure to the MAPK/JNK inhibitor SP00125. Quantification of HSPA5 and CALR3 expression is shown in (A, vi) and (B, vi), respectively. See Figure S7 for immunoblot and immunolocalization results for HSPA5 expression following exposure to the MAPK/JNK inhibitor JNK-IN-8. (C and D) Mid-sagittal lens cryosections obtained from whole lenses that were exposed to the vehicle DMSO, or MAPK/JNK inhibitor, SP600125, for 24 h (C) and 48 h (D) were fixed and labeled with TO-PRO-3 to detect nuclei. Low magnification confocal images (i and ii) in (C and D) represent projections of acquired z-stacks; scale bar, 200 μm. Boxed areas in (i and ii) are shown at higher magnification below (iii and iv). These images were 1-μm optical slices selected from an acquired z-stack; scale bar, 20 μm. Results show pyknosis of nuclei is induced prematurely when MAPK/JNK activation was suppressed for 24 h, followed by nuclear loss after 48 h. See also Figure S8. Results are representative of at least 3 or more independent studies. Error bars represent S.E., */#P ≤ 0.05, t test.

Figure 5. Suppressing MAPK/JNK activation induced removal of lens organelles from the central lens fiber cell zone by autophagy. Immunofluorescence analysis of mid-sagittal lens cryosections co-labeled for CALR3 (green), LC3B (red), and nuclei (TO-PRO-3, blue) prepared from lenses grown in organ culture for 24 h in the presence of (A) the vehicle DMSO, (B) the MAPK/JNK inhibitors SP600125, or (C) the MAPK/JNK inhibitor JNK-IN-8. (A–C, upper panels) equatorial zone, EQ; (A–C, lower panels) central fiber zone, FC. Overlay of CALR3 (green) and LC3B (red) shown in panels on the right. Boxed areas in the FC overlay images are shown at higher magnification in the bottom right corner. Examples of the presence of ER (green) in LC3B-positive autophagic vesicles (red) are indicated by white arrowheads. Represented optical slices were taken from an acquired z-stack. Each optical slice is 0.2-μm thick. Data shows that inhibiting MAPK/JNK activation induced removal of ER in autophagic vesicles in central lens fiber cells. Little colocalization of ER in LC3B-labeled autophagic vesicles was observed in the EQ zone; scale bar, 20 μm. Results are representative of 3 independent studies. See also Figure S9 for similar studies with BECN1.
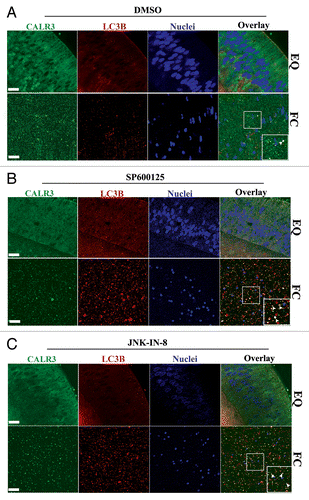
Figure 5. Suppressing MAPK/JNK activation induced removal of lens organelles from the central lens fiber cell zone by autophagy. Immunofluorescence analysis of mid-sagittal lens cryosections co-labeled for CALR3 (green), LC3B (red), and nuclei (TO-PRO-3, blue) prepared from lenses grown in organ culture for 24 h in the presence of (A) the vehicle DMSO, (B) the MAPK/JNK inhibitors SP600125, or (C) the MAPK/JNK inhibitor JNK-IN-8. (A–C, upper panels) equatorial zone, EQ; (A–C, lower panels) central fiber zone, FC. Overlay of CALR3 (green) and LC3B (red) shown in panels on the right. Boxed areas in the FC overlay images are shown at higher magnification in the bottom right corner. Examples of the presence of ER (green) in LC3B-positive autophagic vesicles (red) are indicated by white arrowheads. Represented optical slices were taken from an acquired z-stack. Each optical slice is 0.2-μm thick. Data shows that inhibiting MAPK/JNK activation induced removal of ER in autophagic vesicles in central lens fiber cells. Little colocalization of ER in LC3B-labeled autophagic vesicles was observed in the EQ zone; scale bar, 20 μm. Results are representative of 3 independent studies. See also Figure S9 for similar studies with BECN1.

Figure 6. Premature loss of nuclei and organelles from central lens fiber cells involve inactivation of MTORC1. (A) Cryosection from E15 lens immunostained for MTOR (red). Image is represented as a projection of acquired z-stacks, obtained by confocal microscopy; scale bar, 200 μm. Results show diminished expression of MTOR in the central lens fiber cells (FC). (B) Immunoblot analysis of whole cell lysates (WCL) showed relative expression of MTOR and RPTOR in cortical (FP) and central (FC) fiber zones of the E15 lenses. Co-immunoprecipitation analysis in fiber cell zones isolated by microdissection of E15 lenses demonstrated that the association between MTOR and RPTOR (a measure of the MTORC1 complex) was diminished in the central lens fiber cell zone (FC), consistent with autophagy induction for the formation of the OFZ. This result was quantified as the ratio of RPTOR to MTOR in FP and FC. These results imply disassembly of the MTORC1 complex occurs with lens fiber cell maturation. Error bars represent S.E., *P ≤ 0.05, t test. (C) Cryosections cut from E13 lenses exposed for 24 h to (i and iii) the vehicle, DMSO, or (ii and iv) the MTOR inhibitor rapamycin were immunostained for the ER marker HSPA5/Bip (red) and co-labeled with the nuclear dye TO-PRO-3 (blue). Images were obtained by confocal microscopy. (i and ii) are projection images shown at low magnification; scale bar, 200 μm. Boxed areas in (i and ii) are shown at higher magnification on the right (iii and iv). Each optical slice is 1 μm and was selected from an acquired z-stack; scale bar, 20 μm. (v) Immunoblot analysis of expression of the ER marker HSPA5 in FP and FC lens fiber zones from E13 lenses grown for 24 h in organ culture in the presence of either the vehicle DMSO or the MTOR inhibitor rapamycin. Results indicate premature loss of ER from the central lens fiber cells when the MTOR signal was inhibited with rapamycin. (D) Mid-sagittal cryosections were cut from E13 lenses exposed for 24 h in organ culture to (i and iii) the vehicle, DMSO or (ii and iv) the MTOR inhibitor rapamycin, labeled with the nuclear dye, TO-PRO-3 (blue). (i and ii) are representative projection images at low magnification obtained by confocal microscopy. Boxed regions are shown at higher magnification to the right (iii and iv). Images were selected from acquired z-stacks; each optical slice is 1 μm. Scale bars denote 200 μm (i and ii) and 20 μm (iii and iv). Results show pyknosis and premature loss of nuclei specifically in the central lens fiber cells when the MTOR signal is blocked. Results are representative of 3 independent studies.
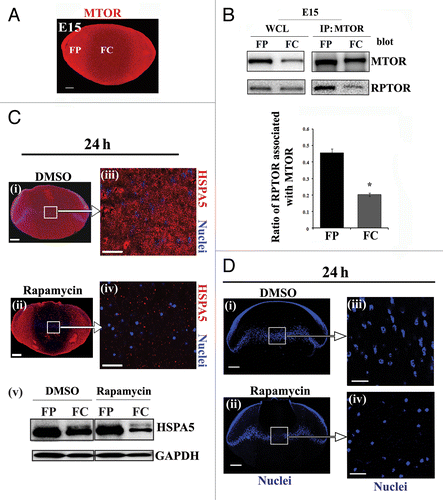
Figure 6. Premature loss of nuclei and organelles from central lens fiber cells involve inactivation of MTORC1. (A) Cryosection from E15 lens immunostained for MTOR (red). Image is represented as a projection of acquired z-stacks, obtained by confocal microscopy; scale bar, 200 μm. Results show diminished expression of MTOR in the central lens fiber cells (FC). (B) Immunoblot analysis of whole cell lysates (WCL) showed relative expression of MTOR and RPTOR in cortical (FP) and central (FC) fiber zones of the E15 lenses. Co-immunoprecipitation analysis in fiber cell zones isolated by microdissection of E15 lenses demonstrated that the association between MTOR and RPTOR (a measure of the MTORC1 complex) was diminished in the central lens fiber cell zone (FC), consistent with autophagy induction for the formation of the OFZ. This result was quantified as the ratio of RPTOR to MTOR in FP and FC. These results imply disassembly of the MTORC1 complex occurs with lens fiber cell maturation. Error bars represent S.E., *P ≤ 0.05, t test. (C) Cryosections cut from E13 lenses exposed for 24 h to (i and iii) the vehicle, DMSO, or (ii and iv) the MTOR inhibitor rapamycin were immunostained for the ER marker HSPA5/Bip (red) and co-labeled with the nuclear dye TO-PRO-3 (blue). Images were obtained by confocal microscopy. (i and ii) are projection images shown at low magnification; scale bar, 200 μm. Boxed areas in (i and ii) are shown at higher magnification on the right (iii and iv). Each optical slice is 1 μm and was selected from an acquired z-stack; scale bar, 20 μm. (v) Immunoblot analysis of expression of the ER marker HSPA5 in FP and FC lens fiber zones from E13 lenses grown for 24 h in organ culture in the presence of either the vehicle DMSO or the MTOR inhibitor rapamycin. Results indicate premature loss of ER from the central lens fiber cells when the MTOR signal was inhibited with rapamycin. (D) Mid-sagittal cryosections were cut from E13 lenses exposed for 24 h in organ culture to (i and iii) the vehicle, DMSO or (ii and iv) the MTOR inhibitor rapamycin, labeled with the nuclear dye, TO-PRO-3 (blue). (i and ii) are representative projection images at low magnification obtained by confocal microscopy. Boxed regions are shown at higher magnification to the right (iii and iv). Images were selected from acquired z-stacks; each optical slice is 1 μm. Scale bars denote 200 μm (i and ii) and 20 μm (iii and iv). Results show pyknosis and premature loss of nuclei specifically in the central lens fiber cells when the MTOR signal is blocked. Results are representative of 3 independent studies.

Figure 7. Suppressing the MAPK/JNK-MTOR-RPTOR signaling pathway led to premature loss of nuclei and organelles in lens fiber cells by autophagy. (A–C) Immunoblot analysis for (A) phospho-(p)-RPS6KB Thr389, RPS6KB, (B) phospho-(p) MTORSer2481, MTOR, and (C) phospho-(p)-RPTORSer863, RPTOR, in cortical (FP) and central (FC) fiber cell zones that were microdissected from lenses exposed to the MAPK/JNK inhibitor, SP600125, the MTOR inhibitor, rapamycin, or the vehicle DMSO. Both the MAPK/JNK and MTOR inhibitors suppressed activation of (A) p-RPS6KB Thr389, (B) p-MTORSer2481 and (C) p-RPTOR Ser863 in both cortical and central lens fiber cells. Immunoblot for GAPDH was included as a loading control. Total expression of RPS6KB and RPTOR were also diminished by the inhibitors in the FC zone. Quantification of the results is represented as the ratio of the phosphorylated (activated) form to the total expression level of the protein. Results show that in the presence of the MAPK/JNK inhibitor phosphorylation of RPTOR on Ser863, activation of MTOR and its downstream target RPS6KB were suppressed. Similar results were observed for rapamycin. (D) Immunostaining in cryosections cut from lenses grown for 24 h in organ culture in the presence of the MAPK/JNK inhibitor, SP600125, or its vehicle DMSO, showed upregulated perinuclear expression of the autophagy marker, ULK1 (red) in central lens fiber cells (FC) when MAPK/JNK activation was suppressed. Sections were colabeled for nuclei with TO-PRO-3 (blue). Images were obtained by confocal microscopy. Each optical slice is 0.2 μm and was selected from an acquired z-stack; scale bar, 20 μm. (E and F) Immunoblot analysis for LC3B-I and its lipid modified, autophagosome-associated form LC3B-II in FP and FC fiber cell zones microdissected from lenses that were exposed for 24 h to (E) the MAPK/JNK inhibitor SP600125, (F) rapamycin, or (E and F) the vehicle DMSO. Immunoblot for GAPDH was included as a loading control. Quantification of results is represented as the ratio of LC3B-II/GAPDH. The results reveal a significant increase in the expression of LC3B-II in both FP and FC following inactivation of either MAPK/JNK or MTOR signaling pathways. Results are representative of 3 or more independent studies. Error bars represent S.E., */#P ≤ 0.05 and **P ≤ 0.01, t test; n.s., nonsignificant.
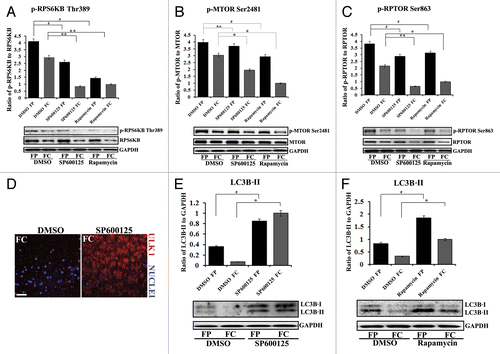
Figure 7. Suppressing the MAPK/JNK-MTOR-RPTOR signaling pathway led to premature loss of nuclei and organelles in lens fiber cells by autophagy. (A–C) Immunoblot analysis for (A) phospho-(p)-RPS6KB Thr389, RPS6KB, (B) phospho-(p) MTORSer2481, MTOR, and (C) phospho-(p)-RPTORSer863, RPTOR, in cortical (FP) and central (FC) fiber cell zones that were microdissected from lenses exposed to the MAPK/JNK inhibitor, SP600125, the MTOR inhibitor, rapamycin, or the vehicle DMSO. Both the MAPK/JNK and MTOR inhibitors suppressed activation of (A) p-RPS6KB Thr389, (B) p-MTORSer2481 and (C) p-RPTOR Ser863 in both cortical and central lens fiber cells. Immunoblot for GAPDH was included as a loading control. Total expression of RPS6KB and RPTOR were also diminished by the inhibitors in the FC zone. Quantification of the results is represented as the ratio of the phosphorylated (activated) form to the total expression level of the protein. Results show that in the presence of the MAPK/JNK inhibitor phosphorylation of RPTOR on Ser863, activation of MTOR and its downstream target RPS6KB were suppressed. Similar results were observed for rapamycin. (D) Immunostaining in cryosections cut from lenses grown for 24 h in organ culture in the presence of the MAPK/JNK inhibitor, SP600125, or its vehicle DMSO, showed upregulated perinuclear expression of the autophagy marker, ULK1 (red) in central lens fiber cells (FC) when MAPK/JNK activation was suppressed. Sections were colabeled for nuclei with TO-PRO-3 (blue). Images were obtained by confocal microscopy. Each optical slice is 0.2 μm and was selected from an acquired z-stack; scale bar, 20 μm. (E and F) Immunoblot analysis for LC3B-I and its lipid modified, autophagosome-associated form LC3B-II in FP and FC fiber cell zones microdissected from lenses that were exposed for 24 h to (E) the MAPK/JNK inhibitor SP600125, (F) rapamycin, or (E and F) the vehicle DMSO. Immunoblot for GAPDH was included as a loading control. Quantification of results is represented as the ratio of LC3B-II/GAPDH. The results reveal a significant increase in the expression of LC3B-II in both FP and FC following inactivation of either MAPK/JNK or MTOR signaling pathways. Results are representative of 3 or more independent studies. Error bars represent S.E., */#P ≤ 0.05 and **P ≤ 0.01, t test; n.s., nonsignificant.

Figure 8. Inhibition of either MAPK/JNK or MTOR signaling induced formation of autophagic vesicles in lens fiber cells. (A) Quantification of the number of autophagic vesicles in lenses grown in organ culture for 24 h in the presence of the vehicle (DMSO), the MAPK/JNK inhibitor (SP600125, 25 μM) or the MTOR inhibitor (rapamycin, 100 nM) showed a significant increase in the number of autophagic vesicles (including autophagosomes and autolysosomes) when MAPK/JNK or MTOR signaling was inhibited. These results provide ultrastructural evidence that autophagy is induced to remove lens organelles when MAPK/JNK and MTOR signals were suppressed. (B) Representative electron micrographs of autophagic vesicles (red arrows) observed in lenses that were exposed to the vehicle (DMSO), the MAPK/JNK inhibitor (SP600125) or the MTOR inhibitor (rapamycin). Autophagic vesicles shown include both autophagosomes and autolysosomes. Double-membraned vesicles are characteristic of autophagosomes, and are shown containing cellular organelles, cellular debris and/or translucent material. Single-membranes with translucent interiors containing cellular debris and degrading organelles are typical of autolysosomes. The images were acquired from an area in the fiber cells at the border of organelle-free zone formation; scale bar, 500 nm. Results are representative of 4 independent studies. Error bars represent SE *P ≤ 0.05, t test.
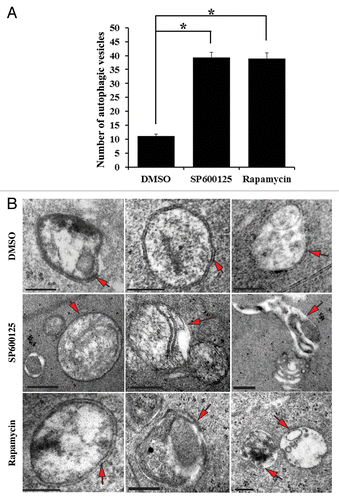
Figure 8. Inhibition of either MAPK/JNK or MTOR signaling induced formation of autophagic vesicles in lens fiber cells. (A) Quantification of the number of autophagic vesicles in lenses grown in organ culture for 24 h in the presence of the vehicle (DMSO), the MAPK/JNK inhibitor (SP600125, 25 μM) or the MTOR inhibitor (rapamycin, 100 nM) showed a significant increase in the number of autophagic vesicles (including autophagosomes and autolysosomes) when MAPK/JNK or MTOR signaling was inhibited. These results provide ultrastructural evidence that autophagy is induced to remove lens organelles when MAPK/JNK and MTOR signals were suppressed. (B) Representative electron micrographs of autophagic vesicles (red arrows) observed in lenses that were exposed to the vehicle (DMSO), the MAPK/JNK inhibitor (SP600125) or the MTOR inhibitor (rapamycin). Autophagic vesicles shown include both autophagosomes and autolysosomes. Double-membraned vesicles are characteristic of autophagosomes, and are shown containing cellular organelles, cellular debris and/or translucent material. Single-membranes with translucent interiors containing cellular debris and degrading organelles are typical of autolysosomes. The images were acquired from an area in the fiber cells at the border of organelle-free zone formation; scale bar, 500 nm. Results are representative of 4 independent studies. Error bars represent SE *P ≤ 0.05, t test.

Figure 9. MAPK/JNK is upstream to MTORC1 in signaling the premature loss of nuclei and organelles in the lens fiber cells. (A–J) Primary lens cell cultures containing mature lentoid structures (multilayered, multicellular, differentiated mini-lens-like structures, shown in Fig. S11) were exposed for 24 h to either the MAPK/JNK inhibitor SP600125, the MTOR inhibitor, rapamycin or their vehicle DMSO. (A–D) Extracts were immunoblotted for (A) phospho-(p)-JUN Ser63/73, JUN, (B) phospho-(p)-pRPS6KB Thr389, RPS6KB, (C) phospho-(p)-MTOR Ser2481, MTOR, or (D) phospho-(p)-RPTOR Ser863, RPTOR. GAPDH was included as a loading control. Quantification is represented as a ratio of phosphorylated (activated) form to total expression levels of the protein. Results show that the MAPK/JNK inhibitor SP600125 effectively blocked activation of JUN, a direct downstream target of JNK, while rapamycin had no significant effect on JUN phosphorylation. Both SP600125 and rapamycin suppressed activation of (B) RPS6KB, (C) MTOR and (D) RPTOR, with MAPK/JNK inhibition causing a greater block of RPTOR phosphorylation than MTOR inhibition. (E) Extracts were immunoblotted for CALR3 and GAPDH. Quantification is represented as a ratio of CALR3 to GAPDH. Loss of the ER marker CALR3 was induced when either MAPK/JNK or MTOR signals were inhibited. (F and G) Cultures were immunostained for (F, i–iii) the Golgi marker, FTCD (F) or (G, i–iii) the mitochondrial marker, TOMM20 (red), colabeled for nuclei with TO-PRO-3 (blue) and examined by confocal microscopy. Images display both a single optical plane and orthogonal (z) sections (above and to the right). Results showed significant loss of Golgi, mitochondria and nuclei in lentoids when either MAPK/JNK or MTOR signals were blocked. (H and I) Extracts were immunoblotted for (H) BECN1 or (I) LC3B, and the loading control GAPDH. Quantification of the results was represented as (H) the ratio of BECN1 to GAPDH and (I) the ratio of LC3B-II to GAPDH. The results demonstrated significant upregulation of BECN1 and LC3B-II following exposure to SP600125 or rapamycin, showing induction of autophagy markers upon inhibiting the MAPK/JNK-MTOR pathway. (J) Live confocal image analysis on lentoid containing cultures exposed for 24 h to (ii and v) the MAPK/JNK inhibitor SP600125 or (iii and vi) the MTOR inhibitor rapamycin labeled with the fluorescent Cyto-ID dye (green) that specifically labels autophagic vesicles. Results showed that both inhibitors induced formation of autophagic vesicles. Lower panels show an overlay of the Cyto-ID fluorescent image with a DIC image. DMSO-exposed lentoids showed little or no labeling with Cyto-ID (i and iv). Images are 1-μm thick optical slices, acquired as z-stacks using confocal microscopy; scale bar, 20 μm. All graphs were plotted as a ratio of the phosphorylated protein to total protein expression or to loading control, GAPDH. Results are representative of at least 3 independent experiments. Error bars represent SE *P ≤ 0.05, t test.
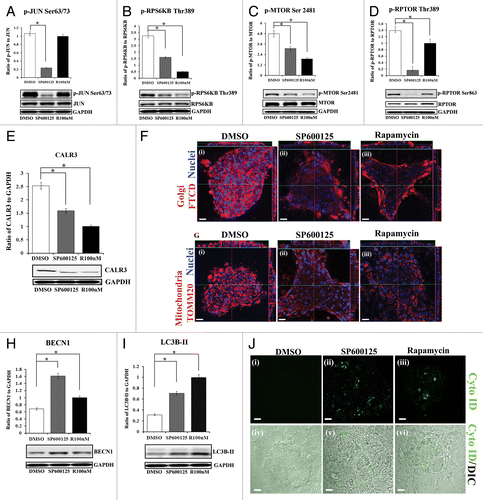
Figure 9. MAPK/JNK is upstream to MTORC1 in signaling the premature loss of nuclei and organelles in the lens fiber cells. (A–J) Primary lens cell cultures containing mature lentoid structures (multilayered, multicellular, differentiated mini-lens-like structures, shown in Fig. S11) were exposed for 24 h to either the MAPK/JNK inhibitor SP600125, the MTOR inhibitor, rapamycin or their vehicle DMSO. (A–D) Extracts were immunoblotted for (A) phospho-(p)-JUN Ser63/73, JUN, (B) phospho-(p)-pRPS6KB Thr389, RPS6KB, (C) phospho-(p)-MTOR Ser2481, MTOR, or (D) phospho-(p)-RPTOR Ser863, RPTOR. GAPDH was included as a loading control. Quantification is represented as a ratio of phosphorylated (activated) form to total expression levels of the protein. Results show that the MAPK/JNK inhibitor SP600125 effectively blocked activation of JUN, a direct downstream target of JNK, while rapamycin had no significant effect on JUN phosphorylation. Both SP600125 and rapamycin suppressed activation of (B) RPS6KB, (C) MTOR and (D) RPTOR, with MAPK/JNK inhibition causing a greater block of RPTOR phosphorylation than MTOR inhibition. (E) Extracts were immunoblotted for CALR3 and GAPDH. Quantification is represented as a ratio of CALR3 to GAPDH. Loss of the ER marker CALR3 was induced when either MAPK/JNK or MTOR signals were inhibited. (F and G) Cultures were immunostained for (F, i–iii) the Golgi marker, FTCD (F) or (G, i–iii) the mitochondrial marker, TOMM20 (red), colabeled for nuclei with TO-PRO-3 (blue) and examined by confocal microscopy. Images display both a single optical plane and orthogonal (z) sections (above and to the right). Results showed significant loss of Golgi, mitochondria and nuclei in lentoids when either MAPK/JNK or MTOR signals were blocked. (H and I) Extracts were immunoblotted for (H) BECN1 or (I) LC3B, and the loading control GAPDH. Quantification of the results was represented as (H) the ratio of BECN1 to GAPDH and (I) the ratio of LC3B-II to GAPDH. The results demonstrated significant upregulation of BECN1 and LC3B-II following exposure to SP600125 or rapamycin, showing induction of autophagy markers upon inhibiting the MAPK/JNK-MTOR pathway. (J) Live confocal image analysis on lentoid containing cultures exposed for 24 h to (ii and v) the MAPK/JNK inhibitor SP600125 or (iii and vi) the MTOR inhibitor rapamycin labeled with the fluorescent Cyto-ID dye (green) that specifically labels autophagic vesicles. Results showed that both inhibitors induced formation of autophagic vesicles. Lower panels show an overlay of the Cyto-ID fluorescent image with a DIC image. DMSO-exposed lentoids showed little or no labeling with Cyto-ID (i and iv). Images are 1-μm thick optical slices, acquired as z-stacks using confocal microscopy; scale bar, 20 μm. All graphs were plotted as a ratio of the phosphorylated protein to total protein expression or to loading control, GAPDH. Results are representative of at least 3 independent experiments. Error bars represent SE *P ≤ 0.05, t test.

Figure 10. Proposed model for the role of MAPK/JNK in regulating MTOR-dependent autophagy for the removal of nuclei and organelles to form the OFZ during lens development. Our results showed that both MAPK/JNK and MTOR are critical components of the machinery that is involved in loss of nuclei and organelles during lens development. Active MAPK/JNK phosphorylates both MTOR and RPTOR in the MTORC1 complex to activate MTORC1 and block autophagy. Conditions that lead to inactivation of MAPK/JNK prevent phosphorylation of RPTOR and activation of MTOR, both essential components of MTORC1, causing disinhibition of the autophagy signal and inducing loss of nuclei and organelles in a tightly regulated manner from the central lens fiber cells to create the organelle-free zone.
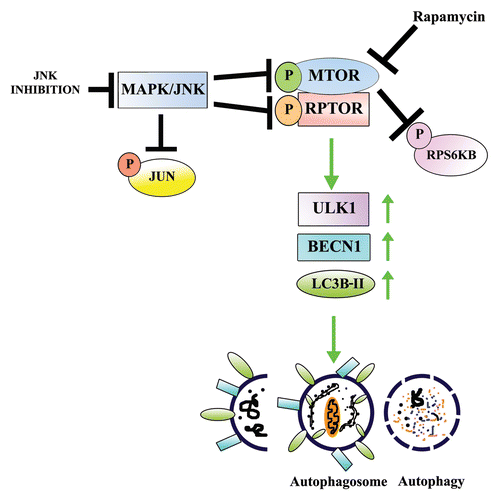
Figure 10. Proposed model for the role of MAPK/JNK in regulating MTOR-dependent autophagy for the removal of nuclei and organelles to form the OFZ during lens development. Our results showed that both MAPK/JNK and MTOR are critical components of the machinery that is involved in loss of nuclei and organelles during lens development. Active MAPK/JNK phosphorylates both MTOR and RPTOR in the MTORC1 complex to activate MTORC1 and block autophagy. Conditions that lead to inactivation of MAPK/JNK prevent phosphorylation of RPTOR and activation of MTOR, both essential components of MTORC1, causing disinhibition of the autophagy signal and inducing loss of nuclei and organelles in a tightly regulated manner from the central lens fiber cells to create the organelle-free zone.
Supplemental material

Additional material

Download Zip (1.3 MB)