2,682
Views
54
CrossRef citations to date
0
Altmetric
Basic Research Paper

Autophagy promotes radiation-induced senescence but inhibits bystander effects in human breast cancer cells

, , , , , & show all
Pages 1212-1228 | Received 17 Apr 2013, Accepted 03 Apr 2014, Published online: 30 Apr 2014

Figures & data

Figure 1. Radiation induced autophagy in MDA-MB-231-2A cells. (A) The levels of PTTG1 in MDA-MB-231, MDA-MB-231-2A, and MCF-7 cells were examined by western blot analysis. (B) MDA-MB-231-2A cells were exposed to different doses of radiation followed by 24 h of recovery time. The ratio of MAP1LC3-II/MAP1LC3-I was analyzed by western blot analysis. (C) EGFP-MAP1LC3-transfected MDA-MB-231-2A cells were exposed to 6-Gy radiation or serum starvation. EGFP intensity was measured by flow cytometry. (D) EGFP-MAP1LC3-transfected MDA-MB-231-2A cells were exposed to 6-Gy radiation or serum starvation. EGFP-MAP1LC3 puncta were measured using fluorescence microscopy. Scale bar: 500 µm. In (C and D), ** indicates significant differences (P < 0.01) between the control and serum starved cells. ## indicates significant differences (P < 0.01) between the control and irradiated cells. (E) MDA-MB-231-2A cells were exposed to 6-Gy radiation, and autophagosome-like structures (arrows) were observed by TEM.
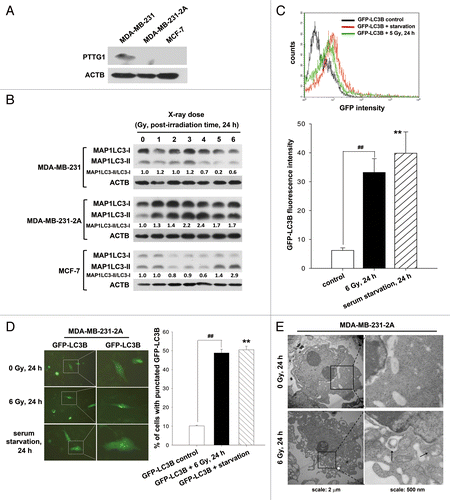
Figure 1. Radiation induced autophagy in MDA-MB-231-2A cells. (A) The levels of PTTG1 in MDA-MB-231, MDA-MB-231-2A, and MCF-7 cells were examined by western blot analysis. (B) MDA-MB-231-2A cells were exposed to different doses of radiation followed by 24 h of recovery time. The ratio of MAP1LC3-II/MAP1LC3-I was analyzed by western blot analysis. (C) EGFP-MAP1LC3-transfected MDA-MB-231-2A cells were exposed to 6-Gy radiation or serum starvation. EGFP intensity was measured by flow cytometry. (D) EGFP-MAP1LC3-transfected MDA-MB-231-2A cells were exposed to 6-Gy radiation or serum starvation. EGFP-MAP1LC3 puncta were measured using fluorescence microscopy. Scale bar: 500 µm. In (C and D), ** indicates significant differences (P < 0.01) between the control and serum starved cells. ## indicates significant differences (P < 0.01) between the control and irradiated cells. (E) MDA-MB-231-2A cells were exposed to 6-Gy radiation, and autophagosome-like structures (arrows) were observed by TEM.

Figure 2. Effect of the autophagic inhibition on radiation-induced autophagy in MDA-MB-231-2A and MCF-7 cells. (A) MDA-MB-231-2A cells were pretreated with or without 3-MA before exposure to 6-Gy radiation. The MAP1LC3-II/MAP1LC3-I ratio was measured by western blot analysis. (B) MDA-MB-231-2A cells were recovered for 18 h after exposure to 6-Gy radiation and were treated with or without bafilomycin A1 for 6 h. The MAP1LC3-II/MAP1LC3-I ratio was measured by western blot analysis. (C) MDA-MB-231-2A cells were exposed to different doses of radiation followed by 24 h of recovery time. SQSTM1 expression was measured by western blot analysis. (D) MDA-MB-231-2A cells were pretreated with or without 3-MA before exposure to 6-Gy radiation. After 24 h of recovery time, SQSTM1 expression was measured by western blot analysis. (E and F) MCF-7 cells were pretreated with or without 3-MA before exposure to 6-Gy radiation. After 24 h of recovery time, the MAP1LC3-II/MAP1LC3-I ratio (E) and SQSTM1 expression (F) were measured by western blot analysis. (G) MDA-MB-231-2A and MCF-7 cells were transfected with ATG5 or non-targeting siRNAs for 48 h before exposure to 6-Gy radiation. After 24 h of recovery time, the MAP1LC3-II/MAP1LC3-I ratio was measured by western blot analysis.
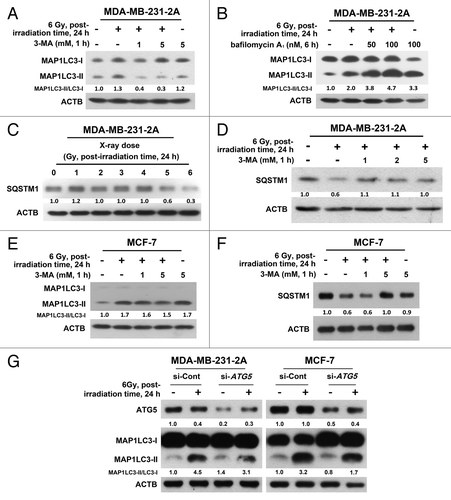
Figure 2. Effect of the autophagic inhibition on radiation-induced autophagy in MDA-MB-231-2A and MCF-7 cells. (A) MDA-MB-231-2A cells were pretreated with or without 3-MA before exposure to 6-Gy radiation. The MAP1LC3-II/MAP1LC3-I ratio was measured by western blot analysis. (B) MDA-MB-231-2A cells were recovered for 18 h after exposure to 6-Gy radiation and were treated with or without bafilomycin A1 for 6 h. The MAP1LC3-II/MAP1LC3-I ratio was measured by western blot analysis. (C) MDA-MB-231-2A cells were exposed to different doses of radiation followed by 24 h of recovery time. SQSTM1 expression was measured by western blot analysis. (D) MDA-MB-231-2A cells were pretreated with or without 3-MA before exposure to 6-Gy radiation. After 24 h of recovery time, SQSTM1 expression was measured by western blot analysis. (E and F) MCF-7 cells were pretreated with or without 3-MA before exposure to 6-Gy radiation. After 24 h of recovery time, the MAP1LC3-II/MAP1LC3-I ratio (E) and SQSTM1 expression (F) were measured by western blot analysis. (G) MDA-MB-231-2A and MCF-7 cells were transfected with ATG5 or non-targeting siRNAs for 48 h before exposure to 6-Gy radiation. After 24 h of recovery time, the MAP1LC3-II/MAP1LC3-I ratio was measured by western blot analysis.

Figure 3. Autophagy promoted radiation-induced senescence in MDA-MB-231-2A cells. (A) MDA-MB-231-2A cells were pretreated with or without 3-MA before exposure to 6-Gy radiation. Bright-field microscopy observation and SA-β-gal staining were performed 2 d after irradiation. (B) MDA-MB-231-2A cells were recovered for 18 h after irradiation and were treated with or without bafilomycin A1. The cells were then observed by bright-field microscopy and stained with SA-β-gal 2 d after irradiation. ** indicates significant differences (P < 0.01) between the control and irradiated cells. ## indicates significant differences (P < 0.01) between the inhibitor-treated and untreated cells. (C) MDA-MB-231-2A cells were transfected with ATG5 or nontargeting siRNAs for 48 h before exposure to 6-Gy radiation. Bright-field microscopy observation and SA-β-gal staining were performed 2 d after irradiation. ** indicates significant differences (P < 0.01) compared with si-Cont cells. n.s. indicates no significant differences between the unirradiated and irradiated si-ATG5 cells. (D) MDA-MB-231-2A cells were pretreated with or without 3-MA before exposure to 6-Gy radiation. Cells were stained with C12FDG, and the fluorescence was analyzed by flow cytometry.
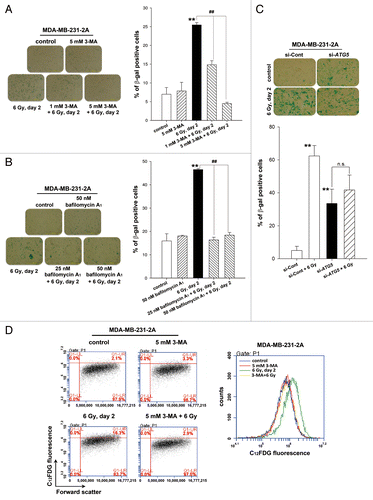
Figure 3. Autophagy promoted radiation-induced senescence in MDA-MB-231-2A cells. (A) MDA-MB-231-2A cells were pretreated with or without 3-MA before exposure to 6-Gy radiation. Bright-field microscopy observation and SA-β-gal staining were performed 2 d after irradiation. (B) MDA-MB-231-2A cells were recovered for 18 h after irradiation and were treated with or without bafilomycin A1. The cells were then observed by bright-field microscopy and stained with SA-β-gal 2 d after irradiation. ** indicates significant differences (P < 0.01) between the control and irradiated cells. ## indicates significant differences (P < 0.01) between the inhibitor-treated and untreated cells. (C) MDA-MB-231-2A cells were transfected with ATG5 or nontargeting siRNAs for 48 h before exposure to 6-Gy radiation. Bright-field microscopy observation and SA-β-gal staining were performed 2 d after irradiation. ** indicates significant differences (P < 0.01) compared with si-Cont cells. n.s. indicates no significant differences between the unirradiated and irradiated si-ATG5 cells. (D) MDA-MB-231-2A cells were pretreated with or without 3-MA before exposure to 6-Gy radiation. Cells were stained with C12FDG, and the fluorescence was analyzed by flow cytometry.

Figure 4. Inhibition of autophagy enhanced the radiosensitivity of MDA-MB-231-2A cells. (A) Left part: MDA-MB-231-2A cells were pretreated with or without 3-MA before exposure to 6-Gy radiation. Right part: MDA-MB-231-2A cells were recovered for 18 h after irradiation and treated with bafilomycin A1 for 6 h. Then, the cells were washed with PBS, and clonogenic survival assays were performed. ** indicates significant differences (P < 0.01) between the control and irradiated cells. ## indicates significant differences (P < 0.01) between the inhibitor-treated and untreated cells. (B) MDA-MB-231-2A cells were transfected with ATG5 or non-targeting siRNAs for 48 h before exposure to 4-Gy radiation. Then, clonogenic survival assays were performed. ** indicates significant differences (P < 0.01) between the si-Cont and irradiated si-Cont cells. ## indicates significant differences (P < 0.01) between the si-Cont and si-ATG5 cells. (C) MDA-MB-231-2A cells were pretreated with or without 3-MA before exposure to 6-Gy radiation. Apoptotic cell death was measured by ANXA5-PI double staining 2 d after irradiation. ANXA5+ and PI-, as well as ANXA5+ and PI+ cells were quantified in (D). ## indicates significant differences (P < 0.01) between the inhibitor-treated and untreated cells. n.s. indicates no significant differences between the control and irradiated cells. (E) MDA-MB-231-2A cells were pretreated with or without 3-MA before exposure to 6-Gy radiation. Cell viability was measured by the MTT assay 2 d after irradiation. ** indicates significant differences (P < 0.01) between the control and irradiated cells. ## indicates significant differences (P < 0.01) between the inhibitor-treated and untreated cells.
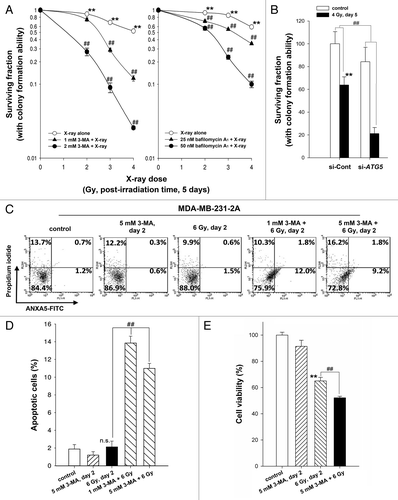
Figure 4. Inhibition of autophagy enhanced the radiosensitivity of MDA-MB-231-2A cells. (A) Left part: MDA-MB-231-2A cells were pretreated with or without 3-MA before exposure to 6-Gy radiation. Right part: MDA-MB-231-2A cells were recovered for 18 h after irradiation and treated with bafilomycin A1 for 6 h. Then, the cells were washed with PBS, and clonogenic survival assays were performed. ** indicates significant differences (P < 0.01) between the control and irradiated cells. ## indicates significant differences (P < 0.01) between the inhibitor-treated and untreated cells. (B) MDA-MB-231-2A cells were transfected with ATG5 or non-targeting siRNAs for 48 h before exposure to 4-Gy radiation. Then, clonogenic survival assays were performed. ** indicates significant differences (P < 0.01) between the si-Cont and irradiated si-Cont cells. ## indicates significant differences (P < 0.01) between the si-Cont and si-ATG5 cells. (C) MDA-MB-231-2A cells were pretreated with or without 3-MA before exposure to 6-Gy radiation. Apoptotic cell death was measured by ANXA5-PI double staining 2 d after irradiation. ANXA5+ and PI-, as well as ANXA5+ and PI+ cells were quantified in (D). ## indicates significant differences (P < 0.01) between the inhibitor-treated and untreated cells. n.s. indicates no significant differences between the control and irradiated cells. (E) MDA-MB-231-2A cells were pretreated with or without 3-MA before exposure to 6-Gy radiation. Cell viability was measured by the MTT assay 2 d after irradiation. ** indicates significant differences (P < 0.01) between the control and irradiated cells. ## indicates significant differences (P < 0.01) between the inhibitor-treated and untreated cells.

Figure 5. CSF2 contributed to the radiation-induced bystander effects by promoting the invasion and migration of MDA-MB-231 cells. (A) MDA-MB-231-2A cells were pretreated with or without 3-MA before exposure to 6-Gy radiation, and the levels of CSF2 in 2A-CM were measured by ELISA. (B and C), MDA-MB-231 cells were treated with serum-free, 10% serum, 2A-CM, or 2A-CM from MDA-MB-231-2A cells pretreated with 3-MA before exposure to irradiation. In (D and E), CSF2-neutralizing antibody (5 µg/mL) was added to the 2A-CM for 1 h and then incubated with MDA-MB-231 cells. The invasion and migration of MDA-MB-231 cancer cells were measured using a Boyden chamber and a wound-healing assay, respectively. The numbers of the invaded and migrated cells were quantified. In (B and C), ** indicates significant differences (P < 0.01) between the control (10% serum) and CM-treated cells. ## indicates significant differences (P < 0.01) between the CM-treated and CM (3-MA)-treated cells. In (D and E), ** indicates significant differences (P < 0.01) between the control (10% serum) and CM-treated cells. ## indicates significant differences (P < 0.01) between the CSF2 antibody-treated and untreated cells.
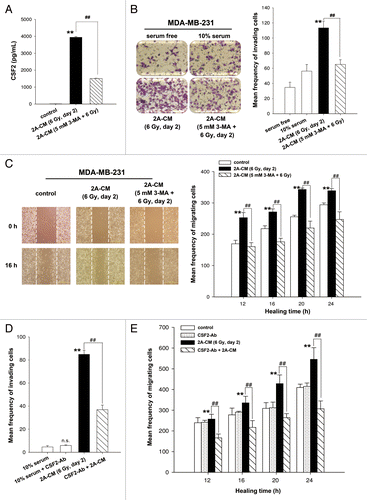
Figure 5. CSF2 contributed to the radiation-induced bystander effects by promoting the invasion and migration of MDA-MB-231 cells. (A) MDA-MB-231-2A cells were pretreated with or without 3-MA before exposure to 6-Gy radiation, and the levels of CSF2 in 2A-CM were measured by ELISA. (B and C), MDA-MB-231 cells were treated with serum-free, 10% serum, 2A-CM, or 2A-CM from MDA-MB-231-2A cells pretreated with 3-MA before exposure to irradiation. In (D and E), CSF2-neutralizing antibody (5 µg/mL) was added to the 2A-CM for 1 h and then incubated with MDA-MB-231 cells. The invasion and migration of MDA-MB-231 cancer cells were measured using a Boyden chamber and a wound-healing assay, respectively. The numbers of the invaded and migrated cells were quantified. In (B and C), ** indicates significant differences (P < 0.01) between the control (10% serum) and CM-treated cells. ## indicates significant differences (P < 0.01) between the CM-treated and CM (3-MA)-treated cells. In (D and E), ** indicates significant differences (P < 0.01) between the control (10% serum) and CM-treated cells. ## indicates significant differences (P < 0.01) between the CSF2 antibody-treated and untreated cells.

Figure 6. CSF2 contributed to the radiation-induced bystander effects via the JAK2-STAT3 and AKT pathways. (A) MDA-MB-231 cells were treated with 2A-CM for the indicated time intervals. The levels of phospho-JAK2, phospho-STAT3, and phospho-AKT were examined by western blot analysis. (B) CSF2-neutralizing antibody (5 µg/mL) was added to the 2A-CM for 1 h and then incubated with MDA-MB-231 cells. phospho-JAK2, phospho-STAT3, and phospho-AKT were examined by western blot analysis. (C–E) MDA-MB-231 cells were treated with or without the JAK2 inhibitor AZD1480 before incubation with 2A-CM. The levels of phospho-JAK2, phospho-STAT3, and phospho-AKT were examined by western blot analysis (C). The invasion (D) and migration (E) of cells were measured using Boyden chamber and wound healing assays, respectively. In (D and E), ** indicates significant differences (P < 0.01) between the control (10% serum) and CM-treated cells. ## indicates significant differences (P < 0.01) between the inhibitor-treated and untreated cells.
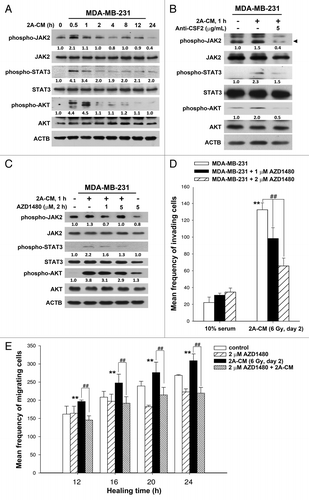
Figure 6. CSF2 contributed to the radiation-induced bystander effects via the JAK2-STAT3 and AKT pathways. (A) MDA-MB-231 cells were treated with 2A-CM for the indicated time intervals. The levels of phospho-JAK2, phospho-STAT3, and phospho-AKT were examined by western blot analysis. (B) CSF2-neutralizing antibody (5 µg/mL) was added to the 2A-CM for 1 h and then incubated with MDA-MB-231 cells. phospho-JAK2, phospho-STAT3, and phospho-AKT were examined by western blot analysis. (C–E) MDA-MB-231 cells were treated with or without the JAK2 inhibitor AZD1480 before incubation with 2A-CM. The levels of phospho-JAK2, phospho-STAT3, and phospho-AKT were examined by western blot analysis (C). The invasion (D) and migration (E) of cells were measured using Boyden chamber and wound healing assays, respectively. In (D and E), ** indicates significant differences (P < 0.01) between the control (10% serum) and CM-treated cells. ## indicates significant differences (P < 0.01) between the inhibitor-treated and untreated cells.

Figure 7. Endogenous autophagy inhibited the radiation-induced bystander effects by promoting the invasion and migration of unirradiated MDA-MB-231 cells. (A) MDA-MB-231 cells were exposed to 2A-CM for the indicated time intervals, and the MAP1LC3-II/MAP1LC3-I ratio was measured by western blot analysis and quantified at each time point. ** indicates significant differences (P < 0.01) compared with the CM-treated cells at day 1. ## indicates significant differences (P < 0.01) between the control and CM-treated cells at each time points. n.s. indicates no significant differences between the control and CM-treated cells. (B) CSF2-neutralizing antibody (5 µg/mL) was added to the 2A-CM for 1 h and then incubated with MDA-MB-231 cells for 1 h. The MAP1LC3-II/MAP1LC3-I ratio was measured by western blot analysis. (C) MDA-MB-231 cells were treated with or without AZD1480 before incubation with 2A-CM. The MAP1LC3-II/MAP1LC3-I ratio was measured by western blot analysis. (D) Upper part: MDA-MB-231 cells were treated with rapamycin for 3 h. Lower part: MDA-MB-231 cells were exposed to 2A-CM with or without rapamycin for 4 h. Western blot analysis was performed to examine the MAP1LC3-II/MAP1LC3-I ratio. (E and F), MDA-MB-231 cells were pretreated with or without rapamycin for 3 h before exposure to 2A-CM. The invasion (E) and the migration (F) of the cells were measured using a Boyden chamber and wound healing assays, respectively. ** indicates significant differences (P < 0.01) between the control (10% serum) and CM-treated cells. ## indicates significant differences (P < 0.01) between the rapamycin-treated and untreated cells.
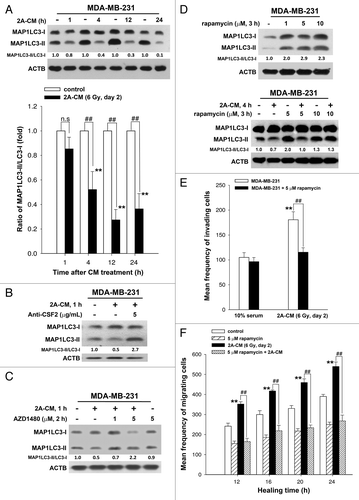
Figure 7. Endogenous autophagy inhibited the radiation-induced bystander effects by promoting the invasion and migration of unirradiated MDA-MB-231 cells. (A) MDA-MB-231 cells were exposed to 2A-CM for the indicated time intervals, and the MAP1LC3-II/MAP1LC3-I ratio was measured by western blot analysis and quantified at each time point. ** indicates significant differences (P < 0.01) compared with the CM-treated cells at day 1. ## indicates significant differences (P < 0.01) between the control and CM-treated cells at each time points. n.s. indicates no significant differences between the control and CM-treated cells. (B) CSF2-neutralizing antibody (5 µg/mL) was added to the 2A-CM for 1 h and then incubated with MDA-MB-231 cells for 1 h. The MAP1LC3-II/MAP1LC3-I ratio was measured by western blot analysis. (C) MDA-MB-231 cells were treated with or without AZD1480 before incubation with 2A-CM. The MAP1LC3-II/MAP1LC3-I ratio was measured by western blot analysis. (D) Upper part: MDA-MB-231 cells were treated with rapamycin for 3 h. Lower part: MDA-MB-231 cells were exposed to 2A-CM with or without rapamycin for 4 h. Western blot analysis was performed to examine the MAP1LC3-II/MAP1LC3-I ratio. (E and F), MDA-MB-231 cells were pretreated with or without rapamycin for 3 h before exposure to 2A-CM. The invasion (E) and the migration (F) of the cells were measured using a Boyden chamber and wound healing assays, respectively. ** indicates significant differences (P < 0.01) between the control (10% serum) and CM-treated cells. ## indicates significant differences (P < 0.01) between the rapamycin-treated and untreated cells.
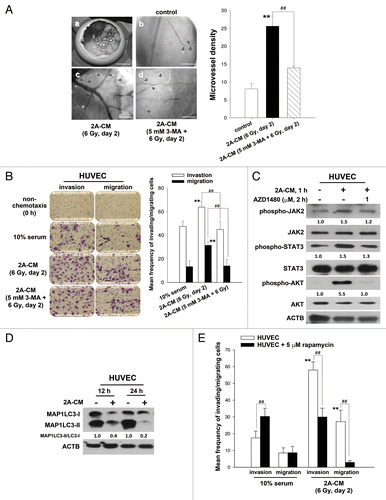
Figure 8. Endogenous autophagy inhibited the radiation-induced bystander effects by promoting the invasion and migration of HUVECs. (A) Observation window of the fertilized chicken eggs was prepared (a) and incubated with control medium (b), 2A-CM (c) or CM from MDA-MB-231-2A cells pretreated with 3-MA before irradiation (d). Microvessels were observed under a dissecting scope (arrowhead). The method for counting the numbers of microvessels was described in Materials and Methods. Scale bars: (a) 5 mm; (b–d) 2 mm. (B) HUVECs were incubated with CM from MDA-MB-231-2A cells pretreated with or without 3-MA before irradiation. The effects on cell invasion and migration were examined using a Boyden chamber and wound healing assays, respectively. ** indicates significant differences (P < 0.01) between the control (10% serum) and CM-treated cells. ## indicates a significant differences (P < 0.01) between the CM- and CM (3-MA)-treated cells. (C) MDA-MB-231-2A cells were pretreated with 3-MA before irradiation. Then, the HUVECs were treated with 2A-CM. The levels of phospho-JAK2, phospho-STAT3 and phospho-AKT were examined by western blot analysis. (D) HUVECs were exposed to 2A-CM, and the MAP1LC3-II/MAP1LC3-I ratio was measured by western blot analysis and quantified at each time point. (E) HUVECs were pretreated with or without rapamycin (5 µM) for 3 h and incubated with 2A-CM. The effects on cell invasion and migration were examined using a Boyden chamber and wound healing assays, respectively. ** indicates significant differences (P < 0.01) between the control (10% serum) and CM-treated cells. ## indicates significant differences (P < 0.01) between the rapamycin-treated and untreated cells.

Figure 8. Endogenous autophagy inhibited the radiation-induced bystander effects by promoting the invasion and migration of HUVECs. (A) Observation window of the fertilized chicken eggs was prepared (a) and incubated with control medium (b), 2A-CM (c) or CM from MDA-MB-231-2A cells pretreated with 3-MA before irradiation (d). Microvessels were observed under a dissecting scope (arrowhead). The method for counting the numbers of microvessels was described in Materials and Methods. Scale bars: (a) 5 mm; (b–d) 2 mm. (B) HUVECs were incubated with CM from MDA-MB-231-2A cells pretreated with or without 3-MA before irradiation. The effects on cell invasion and migration were examined using a Boyden chamber and wound healing assays, respectively. ** indicates significant differences (P < 0.01) between the control (10% serum) and CM-treated cells. ## indicates a significant differences (P < 0.01) between the CM- and CM (3-MA)-treated cells. (C) MDA-MB-231-2A cells were pretreated with 3-MA before irradiation. Then, the HUVECs were treated with 2A-CM. The levels of phospho-JAK2, phospho-STAT3 and phospho-AKT were examined by western blot analysis. (D) HUVECs were exposed to 2A-CM, and the MAP1LC3-II/MAP1LC3-I ratio was measured by western blot analysis and quantified at each time point. (E) HUVECs were pretreated with or without rapamycin (5 µM) for 3 h and incubated with 2A-CM. The effects on cell invasion and migration were examined using a Boyden chamber and wound healing assays, respectively. ** indicates significant differences (P < 0.01) between the control (10% serum) and CM-treated cells. ## indicates significant differences (P < 0.01) between the rapamycin-treated and untreated cells.

Figure 9. A hypothetical model for the role of autophagy in radiation-induced senescence and bystander effects. Radiation induces autophagy and senescence in PTTG1-depleted breast cancer cells (MDA-MB-231-2A and MCF-7). Inhibition of autophagy by 3-MA and bafilomycin A1 blocks radiation-induced senescence. In contrast, induction of autophagy by rapamycin induces senescence. Conditioned medium (CM) from radiation-induced senescent MDA-MB-231-2A and MCF-7 cells promote the invasion and migration of unirradiated neighboring cancer (MDA-MB-231) and normal endothelial (HUVEC) cells (bystander effects). CSF2 in the CM from the radiation-induced senescent cancer cells acts as senescence-associated secretory phenotype (SASP) to exert the bystander effects. CSF2 promotes cell invasion and migration through either the activation of the JAK2-STAT3 and JAK-AKT pathways or the downregulation of endogenous autophagy in bystander cells.
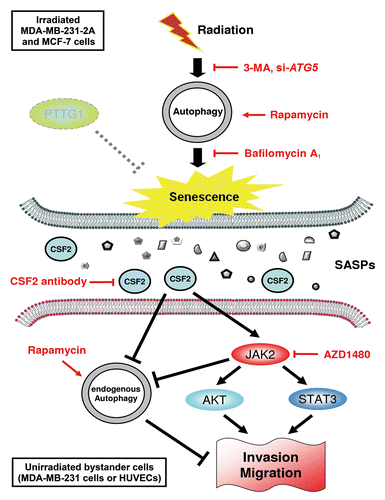
Figure 9. A hypothetical model for the role of autophagy in radiation-induced senescence and bystander effects. Radiation induces autophagy and senescence in PTTG1-depleted breast cancer cells (MDA-MB-231-2A and MCF-7). Inhibition of autophagy by 3-MA and bafilomycin A1 blocks radiation-induced senescence. In contrast, induction of autophagy by rapamycin induces senescence. Conditioned medium (CM) from radiation-induced senescent MDA-MB-231-2A and MCF-7 cells promote the invasion and migration of unirradiated neighboring cancer (MDA-MB-231) and normal endothelial (HUVEC) cells (bystander effects). CSF2 in the CM from the radiation-induced senescent cancer cells acts as senescence-associated secretory phenotype (SASP) to exert the bystander effects. CSF2 promotes cell invasion and migration through either the activation of the JAK2-STAT3 and JAK-AKT pathways or the downregulation of endogenous autophagy in bystander cells.
Supplemental material

Additional material

Download Zip (2.3 MB)

Reprints and Corporate Permissions

Please note: Selecting permissions does not provide access to the full text of the article, please see our help page How do I view content?

To request a reprint or corporate permissions for this article, please click on the relevant link below:

Academic Permissions

Please note: Selecting permissions does not provide access to the full text of the article, please see our help page How do I view content?

Obtain permissions instantly via Rightslink by clicking on the button below:

If you are unable to obtain permissions via Rightslink, please complete and submit this Permissions form. For more information, please visit our Permissions help page.