Figures & data
Figure 1. Increased levels of BECN1 in the spinal cord and frontal cortex of transgenic SOD1G86R mice. (A) SOD1 oligomers, BECN1, and HSP90 expression were determined in spinal cord protein extracts from symptomatic SOD1G86R transgenic (end point of disease) or non-transgenic litter mate control mice (Non-Tg) by western blot. Each lane represents an independent mouse. HSP90 was monitored as a loading control. Right panel: quantification of BECN1 expression levels in spinal cord of transgenic SOD1G86R mice and non-transgenic age-matched controls. Mean and standard error are shown for 3 independent animals per group. (B) In parallel, Becn1 mRNA levels were measured by real-time PCR in the SOD1G86R transgenic mice at the presymptomatic stage (Presym; 90 d after birth) or end point of disease (Sym) in spinal cord (left panel) and in frontal cortex (right panel). Mean and standard error are shown for the analysis of 3 animals per group. (C) Immunofluorescence assay of BECN1 and RBFOX3 staining were performed in frontal cortex tissue derived from SOD1G86R and non-transgenic litter-mate control mice (Non-Tg). A merged image of the triple staining is presented. (D) Using samples described in (C), the expression of BECN1 and the neuronal marker RBFOX3 were analyzed by indirect immunofluorescence followed by confocal microscopy analysis. The right panel shows a magnification of the area marked with a yellow square. A representative image is presented of the analysis of at least 3 independent animals for genotype. Scale bars: 50 μm.
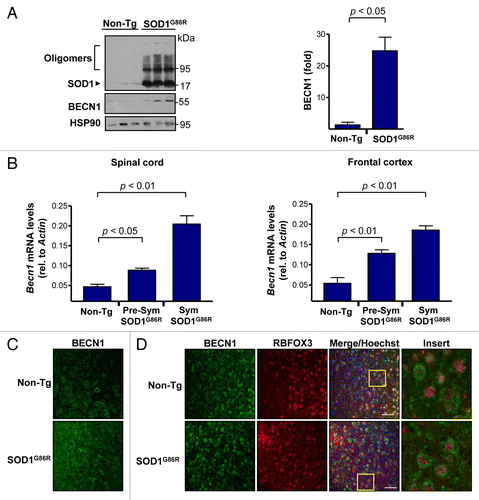
Table 1. Generation of mutant SOD1 transgenic mice that are heretozygous for Becn1
Figure 2.Becn1 haploinsufficiency prolongs life span of mutant SOD1 transgenic mice. (A) Life-span curves in SOD1 transgenic mice (SOD1G86R) on a Becn1 wild-type (Becn1+/+ SOD1G86R, n = 16) or heterozygote (Becn1+/− SOD1G86R, n = 21) background (P = 0.01 obtained by Kaplan-Meier statistics). (B) In the same animals presented in A, disease onset was measured as the loss of 5% of animal total body weight. (C) Average disease onset was calculated by 3 different parameters as described in Materials and Methods: rotarod performance, visual observation of disease signs, and the loss of 5% of animal total body weight. The Student t test analysis indicated no differences between groups. Average and standard error are presented. (D) The duration of the disease was calculated using the measurements of rotarod performance and the survival curve. Average and standard error is presented. P value was determined by the Student t test.
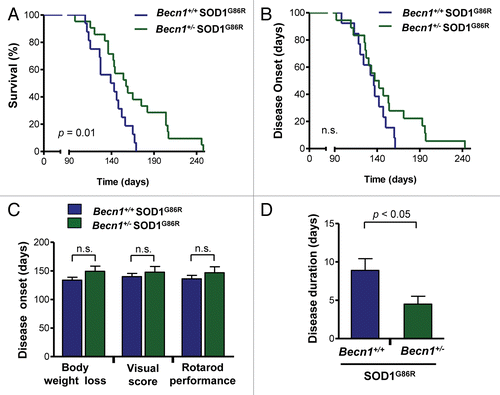
Figure 3. Targeting Becn1 alters SOD1 aggregation in ALS transgenic mice. (A) SOD1 aggregation was determined in spinal cord protein extracts derived from Becn1+/+ SOD1G86R and Becn1+/− SOD1G86R mice at the symptomatic stage using western blot analysis. Each well represents an independent animal ordered by crescent genotype and crescent life span. Of note SOD1 oligomers and high molecular (HMW) aggregates are detected in this analysis. “*” represents the same sample from the first lane of Becn1+/+ SOD1G86R mice presented in the left western blot used as a normalization marker to select equivalent film exposure for proper comparison. (B) Mutant SOD1 oligomers were quantified from experiments presented in (A). For the analysis, the average signal of control transgenic mice (*) was normalized to 1 to compare both gels. (C) In parallel, Sod1 mRNA levels were measured by real-time PCR in samples from presymptomatic and end-of- disease stages (right panel). Actin levels were monitored for normalization of gene expression. In (B) and (C), mean and standard error are presented for the analysis of independent animals (at least n = 6 per group). P values were calculated with the Student t test. n.s., nonsignificant differences.
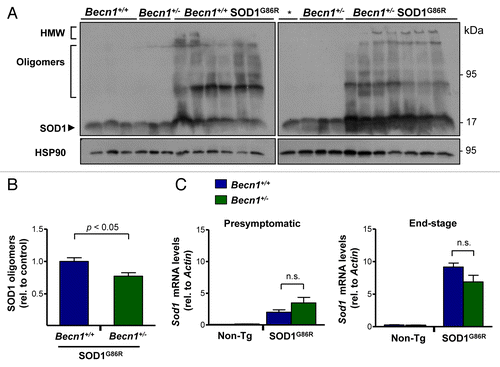
Figure 4. Altered levels of autophagy markers in transgenic SOD1 mice heterozygous for Becn1. (A) Levels of SQSTM1 were monitored in spinal cord extracts of symptomatic SOD1G86R transgenic mice by western blot and quantified by densitometry. Each lane represents a single mouse, ordered by genotype and then by life span (incremented values). “*” represents the same sample from the first lane of a Becn1+/+ SOD1G86R mouse shown in the left gel used as a normalization sample. (B) SQSTM1 levels were quantified from samples described in (A). Statistical analysis was performed using a one-way ANOVA test; data represent mean and standard error of at least 4 independent animals per genotype. (C) Sqstm1 mRNA levels were measured by real-time PCR in samples presented in (A). Mean and standard error is shown. n.s., nonsignificant differences. (D) Immunofluorescence analysis of SQSTM1 (green) and MAP2 staining (neuronal marker, red) or (E) SQSTM1 and GFAP staining (astrocytes, red) was performed in spinal cord tissue derived from SOD1G86R and non-transgenic littermate control mice (Non-Tg). Hoechst staining was also performed (blue). A merged image of the triple staining is presented together with a zoom of the selected area (yellow square). A representative image is presented of the analysis of 3 independent animals for genotype. Scale bars: 10 µm. (F) Levels of LC3-I and II were evaluated by western blot in spinal cord samples from Becn1+/+ SOD1G86R and Becn1+/− SOD1G86R mice. The western blot for LC3-I and II was performed in a 17% SDS-PAGE. Each well represents an independent animal analyzed.
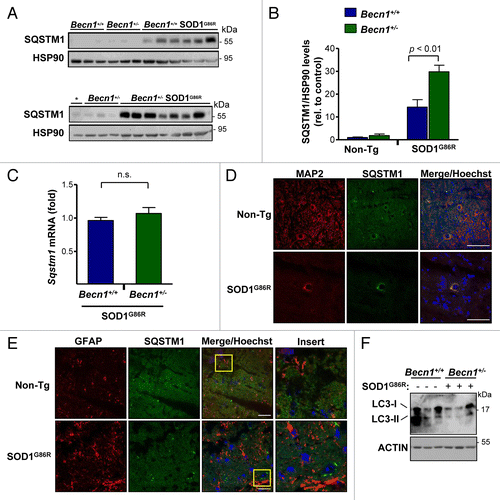
Figure 5. Astrocyte and neuronal content in SOD1G86R mice. (A) Immunofluorescence assay of GFAP (astrocyte marker) and RBFOX3 (neuronal marker) staining was performed in spinal cord tissue derived from Becn1+/+,Becn1+/−, Becn1+/+ SOD1G86R, and Becn1+/− SOD1G86R at the late stage of disease. Hoechst staining was also performed. A merged image of the triple staining is presented together with a zoom of the selected area (yellow square). A representative image is presented of the analysis of 3 independent animals for genotype. Scale bars: 10 µm. (B) Quantification of the GFAP signal intensity is presented for 3 animals from each genotype. Mean and standard deviation are presented. P value was calculated with the Student t test. n.s., nonsignificant differences.
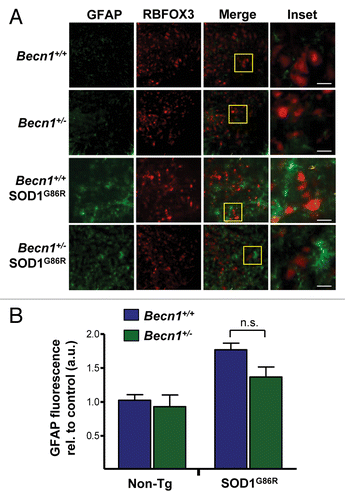
Figure 6. BECN1 expression reduces SOD1 levels in a motoneuron cell line. (A) NSC34 cells were transiently transfected with expression vector for human wild-type and mutant SOD1G85R fused to EGFP. After 72 h, SOD1 levels were monitored in cell extracts prepared in 1% Triton X-100 buffer by western blot. LC3-II levels were also measured in the same samples. As a control, NSC34 cells were treated with 200 nM bafilomycin A1 (Bafilo.) and 10 mg/ml pepstatin (Peps.) lysosome inhibitors for 16 h to induce LC3-II accumulation. (B) Levels of BECN1 and LC3-II were evaluated in cells after transient transfection of NSC34 cells with the mutant SOD1G85R–EGFP vector. HSP90 levels were monitored as a loading control. (C) NSC34 cells were cotransfected with SOD1G85R-EGFP, FLAG-BECN1 in the presence or absence of FLAG-BCL2L1 expression vectors. After 72 h, SOD1 protein oligomers were measured in cell extracts prepared in 1% Triton by western Blot. HSP90 levels were monitored as loading control. Right panel: Quantification of relative SOD1 levels from 3 independent experiments performed and normalized to the values obtained in control cells only expressing mutant SOD1. Mean and standard error are presented. P value was calculated with the Student t test. (D) NSC34 cells were cotransfected with SOD1G85R-EGFP, in the presence or not of BECN1WT, BECN1delta, and FLAG-BCL2L1 -tagged vectors. After 72 h, SOD1-EGFP protein oligomers were measured in cell extracts prepared in 1% Triton X-100 by western Blot. HSP90 levels were measured as loading control. Right panel: As control, BECN1 expression was verified. HSP90 levels were measured as loading control.
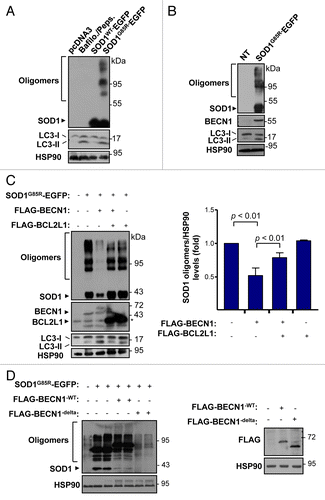
Figure 7. Mutant SOD1 interacts with the BECN1-BCL2L1 complex. (A) Colocalization analysis between FLAG- BECN1 and wild-type or mutant SOD1G85R-EGFP in NSC34 cells. NSC34 cells were transiently cotransfected with expression vectors for human SOD1WT or SOD1G85R-EGFP fusion protein and FLAG- BECN1. After 24 h, SOD1 distribution was visualized by confocal fluorescent microscopy (green) and FLAG- BECN1 detected by indirect immunofluorescence (red). Merge images are provided. Right panel: SOD1G85R-EGFP and FLAG-BECN1 colocalization index was calculated using the Manders coefficient. Mean and standard error is presented. P value was calculated with the Student t test. (B) SOD1G93A-MYC, (C) SOD1G85R-MYC or (D) SOD1WT-MYC or SOD1G93A-MYC (control) were expressed in 293T cells together with BCL2L1 and BECN1-FLAG tagged versions. Immunoprecipitation (IP) assays were performed using anti-MYC antibody-agarose complexes followed by western blot analysis to assess the interaction with BCL2L1 and BECN1. Total protein extracts are shown as control. Results are representative of 3 independent experiments. (E) SOD1G93A-MYC IP was performed in NSC34 cells cotransfected with mutant FLAG-BECN1WT or BECN1delta, and FLAG-BCL2L1 followed by western blot analysis. (F) IP was performed with anti-MYC antibody-agarose complexes in NSC34 cells cotransfected with BECN1-MYC, FLAG-BCL2L1 and mutant SOD1 (both EGFP-tagged). This figure is representative of 3 independent experiments.
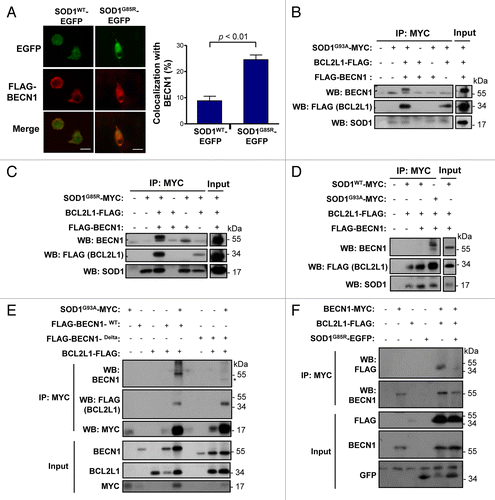
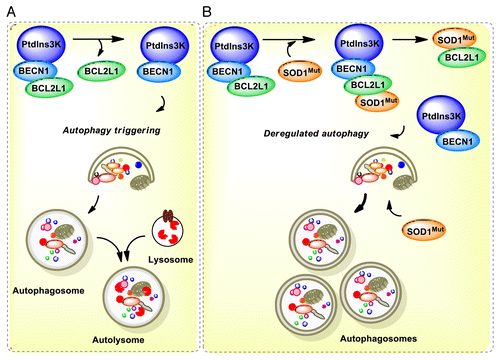
Figure 8. Working model. (A) In a normal condition, BECN1 is inhibited by a direct interaction with BCL2 or BCL2L1 anti-apoptotic proteins. Once autophagy is triggered, BCL2 or BCL2L1 are released from BECN1 and the PtdIns3K (whose catalytic subunit is PIK3C3) is activated, resulting in formation of autophagosomes and downstream autophagy-mediated degradation of cargoes. (B) In ALS, the expression of mutant SOD1 leads to 2 possibilities: a formation of a triple complex between SOD1 and the BECN1-BCL2L1 complex or to an abnormal association with the BECN1 and BCL2L1 complex, destabilizing the interaction leading to abnormal autophagy levels. These pathological effects may be attenuated by the reduction of BECN1 levels in BECN1 heterozygous animals, which may normalize autophagy activity. In addition, mutant SOD1 aggregates are substrates of autophagy-mediated degradation.