5,706
Views
379
CrossRef citations to date
0
Altmetric
Clinical Research Paper

A phase I/II trial of hydroxychloroquine in conjunction with radiation therapy and concurrent and adjuvant temozolomide in patients with newly diagnosed glioblastoma multiforme

, , , , , , , , , , , , , , , , , , & show all
Pages 1359-1368 | Received 21 Nov 2013, Accepted 23 Apr 2014, Published online: 20 May 2014

Figures & data

Table 1. Demographics

Table 2. Phase II adverse events related to study drug

Table 3. Overall survival

Figure 1. Pharmacodynamic evidence of autophagy inhibition in patients treated with temozolomide (TMZ), radiation (RT), and hydroxychloroquine (HCQ). (A) Mixed-effects model of mean ± SD autophagic vacuoles (AVs)/cell. Dotted line: regression line. (B) Representative electron micrographs from a patient treated with chemoradiation and HCQ 800 mg/d for 3 wk. Arrows, AV; scale bar: 2 µm. (C) Immunoblotting against LC3 in the lysates of PBMC obtained from the same patient in (B). P, pretreatment; W3, 3 wk of treatment.
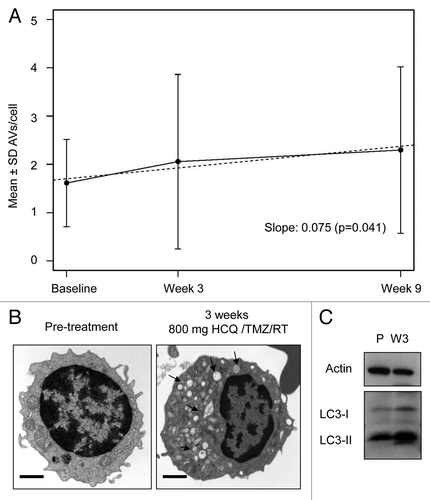
Figure 1. Pharmacodynamic evidence of autophagy inhibition in patients treated with temozolomide (TMZ), radiation (RT), and hydroxychloroquine (HCQ). (A) Mixed-effects model of mean ± SD autophagic vacuoles (AVs)/cell. Dotted line: regression line. (B) Representative electron micrographs from a patient treated with chemoradiation and HCQ 800 mg/d for 3 wk. Arrows, AV; scale bar: 2 µm. (C) Immunoblotting against LC3 in the lysates of PBMC obtained from the same patient in (B). P, pretreatment; W3, 3 wk of treatment.

Figure 2. Population pharmacokinetic-pharmacodynamic analysis. (A) Individual predicted HCQ whole blood concentrations vs. observed concentrations using a 2-compartment population pharmacokinetic model. (B) Observed HCQ concentrations in whole blood by dose cohort. (C) CART analysis. (D) Median AV change in patients with estimated HCQ Cmax above or below 1785 ng/mL.
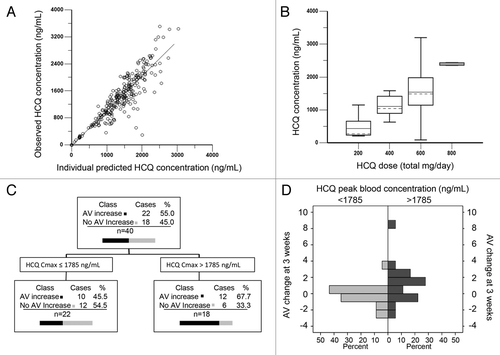
Figure 2. Population pharmacokinetic-pharmacodynamic analysis. (A) Individual predicted HCQ whole blood concentrations vs. observed concentrations using a 2-compartment population pharmacokinetic model. (B) Observed HCQ concentrations in whole blood by dose cohort. (C) CART analysis. (D) Median AV change in patients with estimated HCQ Cmax above or below 1785 ng/mL.

Table 4. Hydroxychloroquine population pharmacokinetic parameter estimates

Supplemental material

Additional material

Download Zip (434.3 KB)