3,371
Views
287
CrossRef citations to date
0
Altmetric
Clinical Research Paper

Combined autophagy and proteasome inhibition

A phase 1 trial of hydroxychloroquine and bortezomib in patients with relapsed/refractory myeloma

, , , , , , , , , , , , , , , & show all
Pages 1380-1390 | Received 21 Nov 2013, Accepted 16 May 2014, Published online: 20 May 2014

Figures & data

Table 1. Subject characteristics

Table 2. Pre-specified dose levels

Figure 1. Schema of study treatment and acquisition of correlative samples. Patients started a 2-wk run-in of single-agent hydroxychloroquine (HCQ), which they continued during 3 wk cycles of standard bortezomib (B) on d 1, 4, 8, and 11. Solid arrows indicate time points at which samples were obtained for all patients; this included peripheral blood mononuclear cells obtained at baseline, on d 1 and 8 of cycle 1, and on d 1 of cycle 2, as well as bone marrow samples obtained at baseline and on d 1 of cycle 1. The hatched arrows indicate that the bone marrow samples obtained on combined HCQ and bortezomib were either on d 5 of cycle 1 (the final 3 patients) or d 1 of cycle 2 (all previous patients).

Figure 1. Schema of study treatment and acquisition of correlative samples. Patients started a 2-wk run-in of single-agent hydroxychloroquine (HCQ), which they continued during 3 wk cycles of standard bortezomib (B) on d 1, 4, 8, and 11. Solid arrows indicate time points at which samples were obtained for all patients; this included peripheral blood mononuclear cells obtained at baseline, on d 1 and 8 of cycle 1, and on d 1 of cycle 2, as well as bone marrow samples obtained at baseline and on d 1 of cycle 1. The hatched arrows indicate that the bone marrow samples obtained on combined HCQ and bortezomib were either on d 5 of cycle 1 (the final 3 patients) or d 1 of cycle 2 (all previous patients).

Table 3. Clinically significant adverse events during combined bortezomib and hydroxychloroquine, number of patients by dose level

Table 4. Best responses to combined bortezomib/hydroxychloroquine, by dose level, including all subjects evaluable for response

Table 5. Best responses to combined bortezomib/hydroxychloroquine, by prior response to bortezomib, including all subjects evaluable for response

Figure 2. Therapy-associated autophagy modulation in myeloma cells from a patient treated with hydroxychloroquine 400 mg daily and standard bortezomib. (A) Representative electron micrographs of CD138-selected bone marrow plasma cells. Red arrows indicate AVs; orange arrows indicate mitochondria. Scale bar: 2 µm. Samples were obtained from a single patient (patient 13, on dose cohort 4) prior to treatment (baseline), after the 2-wk HCQ run-in on d 1 of cycle 1, and prior to therapy on d 1 of cycle 2. (B) Quantification of AVs in bone marrow plasma cells from patient 13 obtained at baseline, d 1 of cycle 1 (C1D1), and d 1 of cycle 2 (C2D1). Vacuole counts from 2 assessors blinded to patient and time point were averaged, with error bars reflecting the standard error of measurement across 25 cells per sample. The treatment schema shows the timing of administration of daily oral hydroxychloroquine (HCQ) and intravenous bortezomib (B). (C) Immunoblotting of bone marrow plasma cells from patient 13 at the same time points.
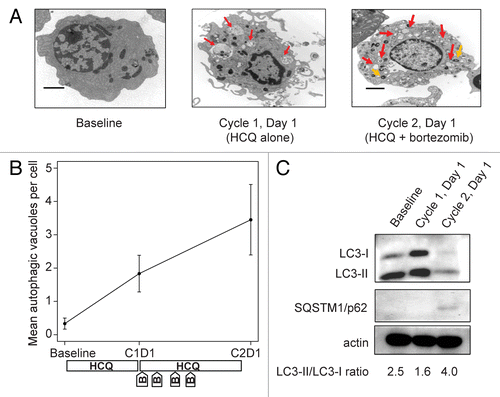
Figure 2. Therapy-associated autophagy modulation in myeloma cells from a patient treated with hydroxychloroquine 400 mg daily and standard bortezomib. (A) Representative electron micrographs of CD138-selected bone marrow plasma cells. Red arrows indicate AVs; orange arrows indicate mitochondria. Scale bar: 2 µm. Samples were obtained from a single patient (patient 13, on dose cohort 4) prior to treatment (baseline), after the 2-wk HCQ run-in on d 1 of cycle 1, and prior to therapy on d 1 of cycle 2. (B) Quantification of AVs in bone marrow plasma cells from patient 13 obtained at baseline, d 1 of cycle 1 (C1D1), and d 1 of cycle 2 (C2D1). Vacuole counts from 2 assessors blinded to patient and time point were averaged, with error bars reflecting the standard error of measurement across 25 cells per sample. The treatment schema shows the timing of administration of daily oral hydroxychloroquine (HCQ) and intravenous bortezomib (B). (C) Immunoblotting of bone marrow plasma cells from patient 13 at the same time points.

Figure 3. Therapy-associated autophagy modulation in myeloma and peripheral blood mononuclear cells from patients treated with hydroxychloroquine (HCQ) and bortezomib. Shown are mean autophagic vacuole counts in (A) bone marrow plasma cells and (B) PBMCs sampled during therapy. The bone marrow results were taken at baseline, on d 1 of cycle 1 (C1D1, after a 2-wk HCQ run-in), and either on d 5 of cycle 1 (C1D5, ~24 h after the d 4 bortezomib dose) or on d 1 of cycle 2 (C2D1, ~10 d after the d 11 bortezomib dose). Peripheral blood samples were obtained at baseline, on C1D1, on d 8 of cycle 1 (C1D8), and on C2D1. P values are shown for comparisons across all time points, and asterisks indicate time points that are significantly (P < 0.05) different from baseline. The treatment schema below each panel shows the timing of administration of daily oral hydroxychloroquine (HCQ) and intravenous bortezomib (B). (C) Correlation between autophagic vacuole counts in peripheral blood mononuclear cells and bone marrow plasma cells for all time points at which patients had both samples obtained at the same time. Correlation coefficients were not statistically significant at baseline (0.34, P = 0.21), C1D1 (0.10, P = 0.77), or C2D1 (0.65, P = 0.18).
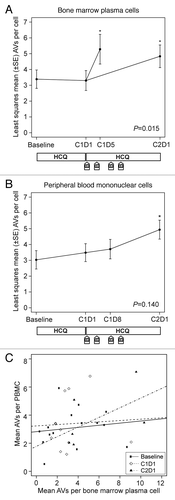
Figure 3. Therapy-associated autophagy modulation in myeloma and peripheral blood mononuclear cells from patients treated with hydroxychloroquine (HCQ) and bortezomib. Shown are mean autophagic vacuole counts in (A) bone marrow plasma cells and (B) PBMCs sampled during therapy. The bone marrow results were taken at baseline, on d 1 of cycle 1 (C1D1, after a 2-wk HCQ run-in), and either on d 5 of cycle 1 (C1D5, ~24 h after the d 4 bortezomib dose) or on d 1 of cycle 2 (C2D1, ~10 d after the d 11 bortezomib dose). Peripheral blood samples were obtained at baseline, on C1D1, on d 8 of cycle 1 (C1D8), and on C2D1. P values are shown for comparisons across all time points, and asterisks indicate time points that are significantly (P < 0.05) different from baseline. The treatment schema below each panel shows the timing of administration of daily oral hydroxychloroquine (HCQ) and intravenous bortezomib (B). (C) Correlation between autophagic vacuole counts in peripheral blood mononuclear cells and bone marrow plasma cells for all time points at which patients had both samples obtained at the same time. Correlation coefficients were not statistically significant at baseline (0.34, P = 0.21), C1D1 (0.10, P = 0.77), or C2D1 (0.65, P = 0.18).

Figure 4. Correlation of predicted and observed hydroxychloroquine (HCQ) levels. Shown are observed HCQ whole blood concentrations vs. individual predicted concentrations from a population pharmacokinetic model in patients treated with HCQ and bortezomib.
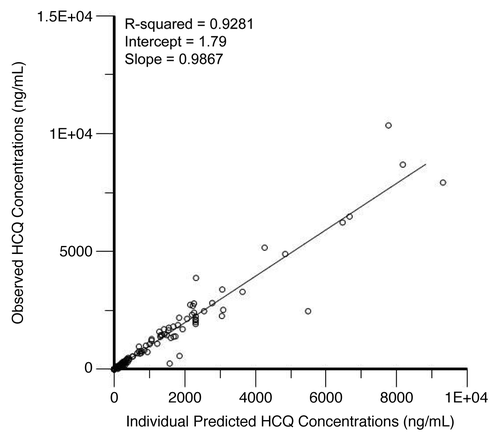
Figure 4. Correlation of predicted and observed hydroxychloroquine (HCQ) levels. Shown are observed HCQ whole blood concentrations vs. individual predicted concentrations from a population pharmacokinetic model in patients treated with HCQ and bortezomib.

Figure 5. Hydroxychloroquine (HCQ) levels in patients receiving HCQ and bortezomib for myeloma. Shown are steady-state HCQ whole blood concentrations, by average daily HCQ dose. Steady-state HCQ concentrations are estimated from a population pharmacokinetic model. The graph shows the median (solid horizontal line), mean (dashed horizontal line), 25th–75th percentiles (box), and 5th–95th percentiles (whiskers).
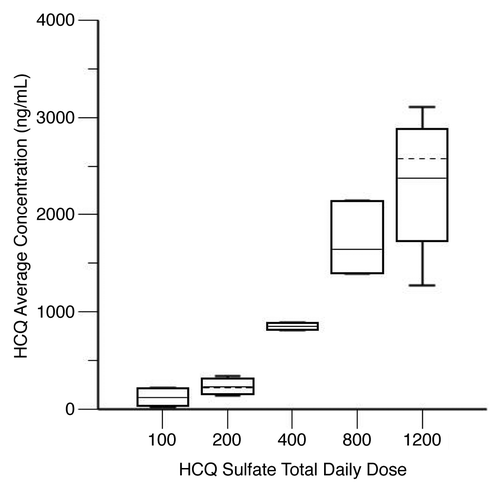
Figure 5. Hydroxychloroquine (HCQ) levels in patients receiving HCQ and bortezomib for myeloma. Shown are steady-state HCQ whole blood concentrations, by average daily HCQ dose. Steady-state HCQ concentrations are estimated from a population pharmacokinetic model. The graph shows the median (solid horizontal line), mean (dashed horizontal line), 25th–75th percentiles (box), and 5th–95th percentiles (whiskers).

Table 6. Final HCQ population pharmacokinetic parameter estimates

Reprints and Corporate Permissions

Please note: Selecting permissions does not provide access to the full text of the article, please see our help page How do I view content?

To request a reprint or corporate permissions for this article, please click on the relevant link below:

Academic Permissions

Please note: Selecting permissions does not provide access to the full text of the article, please see our help page How do I view content?

Obtain permissions instantly via Rightslink by clicking on the button below:

If you are unable to obtain permissions via Rightslink, please complete and submit this Permissions form. For more information, please visit our Permissions help page.