3,791
Views
72
CrossRef citations to date
0
Altmetric
Protocol

Sorting cells for basal and induced autophagic flux by quantitative ratiometric flow cytometry

&
Pages 1327-1334 | Received 24 Jan 2014, Accepted 28 May 2014, Published online: 05 Jun 2014

Figures & data

Figure 1. mCherry-GFP-LC3 reporter cells enable flow cytometric quantification and sorting of cells based on autophagic flux. (A) Quantification of autophagic flux by flow cytometry using reporter cells stably expressing mCherry-GFP-LC3. Using the ratio of mCherry to GFP, autophagic flux can be easily and consistently measured in individual cells. (B) Overview of protocol for sorting cells by autophagic flux. First, cells must be generated which stably express mCherry-GFP-LC3 (C-G-LC3). Second, individual clones (or flow sorted pools) must be characterized based on their expression of mCherry and GFP and ability to induce flux in response to an autophagic stimulus. Third, cells treated with a given stimulus can be flow sorted based on their relative ratios of mCherry and GFP fluorescence into populations of high and low autophagic flux.
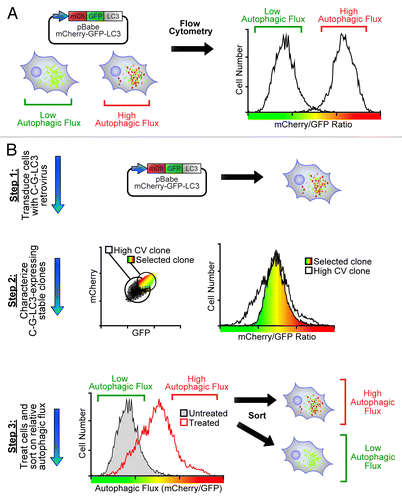
Figure 1. mCherry-GFP-LC3 reporter cells enable flow cytometric quantification and sorting of cells based on autophagic flux. (A) Quantification of autophagic flux by flow cytometry using reporter cells stably expressing mCherry-GFP-LC3. Using the ratio of mCherry to GFP, autophagic flux can be easily and consistently measured in individual cells. (B) Overview of protocol for sorting cells by autophagic flux. First, cells must be generated which stably express mCherry-GFP-LC3 (C-G-LC3). Second, individual clones (or flow sorted pools) must be characterized based on their expression of mCherry and GFP and ability to induce flux in response to an autophagic stimulus. Third, cells treated with a given stimulus can be flow sorted based on their relative ratios of mCherry and GFP fluorescence into populations of high and low autophagic flux.

Table 1. Cell lines used to measure autophagic flux by flow cytometry

Figure 2. Quantification of autophagic flux by flow cytometry. (A) Example of flow-cytometry data illustrating flow cytometer setup for measuring autophagic flux. Scatter and singlet gates should be used to eliminate debris, dead cells, and mitotic cells. Voltages and gain on GFP and mCherry detectors are set empirically to allow both negative and positive control (starvation) plots to fit the mCherry/GFP ratio histogram. (B) Comparison of this protocol to other previously published methods for flow cytometric quantification of autophagy. C-G-LC3 reporter cells were starved for 4 h in EBSS followed by flow cytometry with or without extraction of cytosolic (nonlipidated) LC3 by saponin. (C) Concurrent measurement of autophagic flux and apoptosis using the established flow cytometry markers ANXA5/annexinV and DAPI. C-G-LC3 reporter cells were treated with an apoptotic stimulus (Fas ligand) for 4 h and stained with ANXA5/annexinV-APC and DAPI followed by flow cytometry.
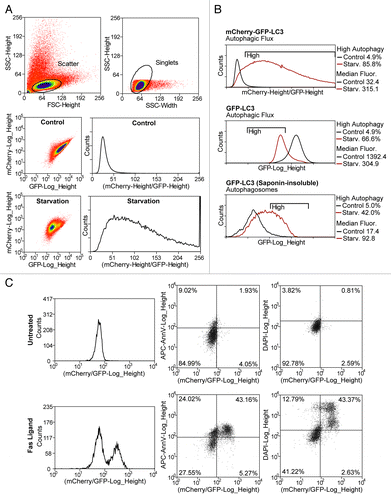
Figure 2. Quantification of autophagic flux by flow cytometry. (A) Example of flow-cytometry data illustrating flow cytometer setup for measuring autophagic flux. Scatter and singlet gates should be used to eliminate debris, dead cells, and mitotic cells. Voltages and gain on GFP and mCherry detectors are set empirically to allow both negative and positive control (starvation) plots to fit the mCherry/GFP ratio histogram. (B) Comparison of this protocol to other previously published methods for flow cytometric quantification of autophagy. C-G-LC3 reporter cells were starved for 4 h in EBSS followed by flow cytometry with or without extraction of cytosolic (nonlipidated) LC3 by saponin. (C) Concurrent measurement of autophagic flux and apoptosis using the established flow cytometry markers ANXA5/annexinV and DAPI. C-G-LC3 reporter cells were treated with an apoptotic stimulus (Fas ligand) for 4 h and stained with ANXA5/annexinV-APC and DAPI followed by flow cytometry.