Figures & data
Figure 1. The tail-fin injection model, enabling the induction of a localized infection in zebrafish larvae. The needle indicates the location for injection in the tail fin of 3 dpf zebrafish larvae. The inset represents the region imaged by CLSM. The transgenic larva expressing membrane-bound GFP was injected with fluorescently labeled M. marinum (shown in red). The larva is imaged and presented from a lateral and dorsal perspective, showing the epithelial cell layers and the bacteria residing in these layers and in the extracellular space between these layers.
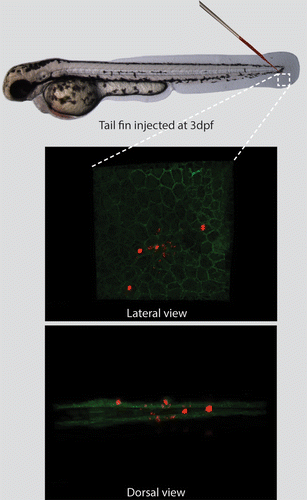
Figure 2.M. marinum infection attracts leukocytes forming an initial stage granuloma. The course of M. marinum (red) infection is shown in Tg(mpx:GFP) larvae. Larvae have been stained using Lcp1 immunohistochemistry for leukocytes. Recruitment of neutrophils (green) and leukocytes (blue) was observed in the tail fin. In the top panels (A–D) an overview image of the entire tail fin at the indicated time point is presented. In the lower panels (A’–D’) higher magnification images of the indicated regions are shown. The scale bars represent 100 μm for the images on the top panels and 20 μm for the bottom panels. For each time point approximately 20 larvae were imaged and representative images for each time point are shown.
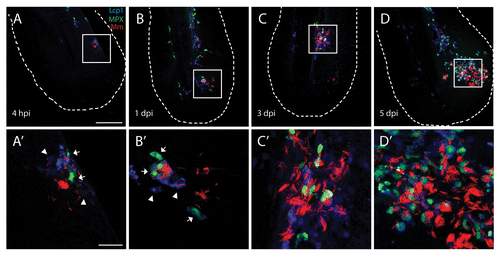
Figure 3. Autophagy is induced during M. marinum infection. M. marinum infected Tg(CMV:EGFP-map1lc3b) larvae were imaged at different time points after infection. GFP-Lc3-positive (green) vesicles were observed at the site of infection from 4 hpi to 5 dpi in the vicinity of the pathogens (red) by CLSM. In the top panels (A–D) an overview of the entire tail fin imaged at low magnification is shown. In the bottom panels (A’–D’) the indicated region imaged at higher magnification is presented. A necrotic center is formed at the center of the initial stage granuloma at 5 dpi. The scale bars represent 100 μm for the images in the top panels and 20 μm for images in the bottom panels. For each time point approximately 20 larvae were imaged and representative images for each time point are shown.
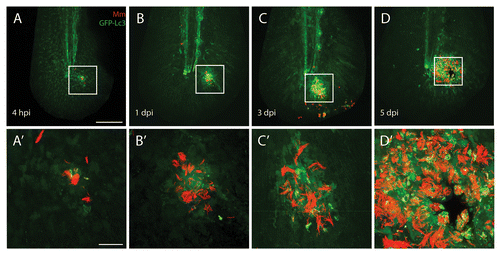
Figure 4. The GFP-Lc3 response observed during M. marinum infection. Tg(CMV:EGFP-map1lc3b) larvae infected with M. marinum at 5 dpi were imaged with CLSM. (A) Representative image of a granuloma in the infected tail fin. The GFP-Lc3 signal (green) and fluorescently labeled bacteria (red) are shown. (B–H) Magnified images of regions indicated in (A). (B) In highly infected cells near the necrotic center (NC) accumulation of GFP-Lc3-positive vesicles was observed (indicated by arrow). (C–F) In cells shown in these images larger GFP-Lc3-positive vesicles were observed, which entirely surround the bacteria (indicated by arrows). (G and H) In lowly infected cells GFP-Lc3-positive vesicles were observed in the vicinity of bacteria (indicated by arrows). Red and green signals from (B–H) are presented separately in (B’–H’) and (B”–H”), respectively. Scale bars: (A) 30 μm and (B–H) 3 μm.
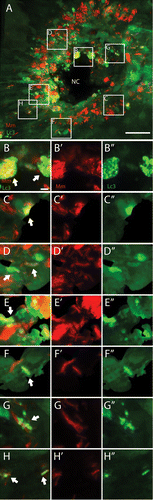
Figure 5.M. marinum containing GFP-Lc3-positive vesicles differ between leukocytes and other cell types. Tg(CMV:EGFP-map1lc3b) larvae infected with M. marinum at 5 dpi were immunostained for Lcp1, and their tail fins were imaged using CLSM. (A) Representative image of a granuloma in the infected tail fin. The GFP-Lc3 signal (green), Lcp1 immunostaining (blue) and fluorescently labeled bacteria (red) are shown. (B) Quantification of GFP-Lc3-positive vesicles for 13 granulomas (1 per tail fin) having sequestered M. marinum inside and outside Lcp1-positive leukocytes. The data (mean ± SEM) were analyzed using a paired 2-tailed Student t test (n = 13). *** indicates P < 0.001. (C) The GFP-Lc3 signal (green) and bacteria (red) in Lcp1-positive cells. (D) The GFP-Lc3 signal (green) and bacteria (red) outside Lcp1-positive cells. Scale bar: 30 μm.
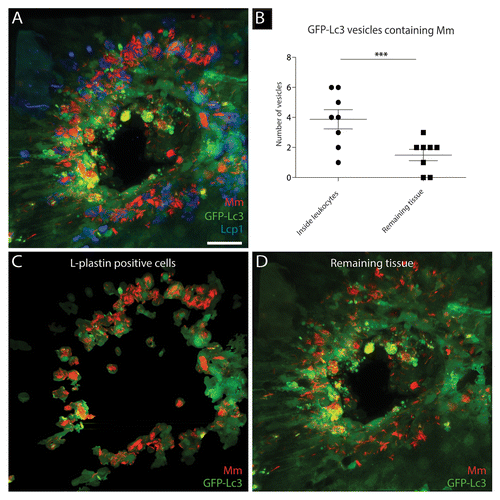
Figure 6. The majority of GFP-Lc3-positive vesicles having sequestered M. marinum are LyTR-positive. Tg(CMV:EGFP-map1lc3b) larvae infected with M. marinum at 5 dpi were stained with LyTR and their tail fins were imaged using CLSM. (A and B) Representative images of M. marinum in GFP-Lc3-positive vesicles that were positive (A) or negative (B) for LyTR. Magnified images of the regions indicated in (A and B) are presented separately for M. marinum (red) and GFP-Lc3 (green) in (A’ and B’), and for M. marinum (red) and LyTR (blue) in (A” and B”). (C) Quantification of M. marinum containing GFP-Lc3-positive vesicles, positive or negative for LyTR. The data (mean ± SEM) were analyzed using a paired 2-tailed Student t test (n = 13). *** indicates P < 0.001 and ** P < 0.01. (D) Quantification of small GFP-Lc3 vesicles positive and negative for LyTR. The data (mean ± SEM) were analyzed using a paired 2-tailed Student t test (n = 13). (E) Representative image of a 3D-rendered representation of small (~1μm) GFP-Lc3 vesicles, negative (green) or positive (blue) for LyTR. Scale bars: (A and B) 5 μm, (A’ and B’) 1 μm, and (E) 25 μm.
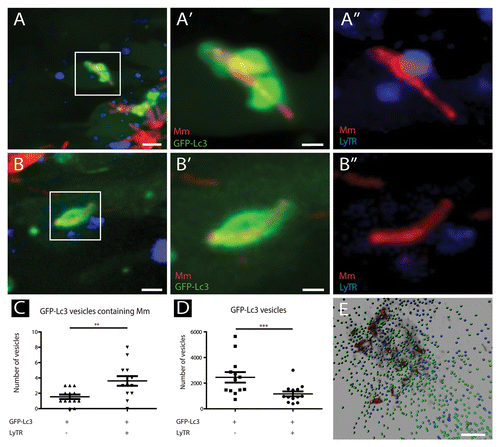
Figure 7. TEM images of tail fin of zebrafish larva infected with M. marinum. (A) Overview image of a granuloma with necrotic center (NC) in the tail fin at 5 dpi. The tail fin is oriented anterior to the top and ventral to the left and the position of the notochord (NTO) is indicated. (B) Higher magnification of the region indicated in (A), showing part of a macrophage with bacteria of which one in a double-membrane autophagic vacuole (black asterisk) and 2 were cytoplasmic (white asterisk). (B’) Higher magnification of bacteria in an initial autophagic vacuole in (B), with arrows indicating the typical double membrane with electron-lucent cleft and arrowheads indicating ribosomes inside (white) and outside (black) of the vacuole. The ruffled appearance of the double membrane could be a fixation or sectioning artifact. (C) Higher magnification of region indicated in (A), showing a single bacterium (asterisk) in a degradative autophagic vacuole. (C’) Higher magnification of the degradative autophagic vacuole containing bacteria in (C), showing a lysosome fused with this vacuole (arrow), which contains partially degraded cytoplasmic material (arrowhead). (D) Higher magnification of indicated region, showing a macrophage with several phagosomal compartments containing bacteria. (E) Higher magnification of indicated region, showing infected epithelial cells. Scale bars: (A) 5 μm, (B and C) 1 μm, (B’) 250 nm, (C’) 500 nm, and (D and E) 10 μm.
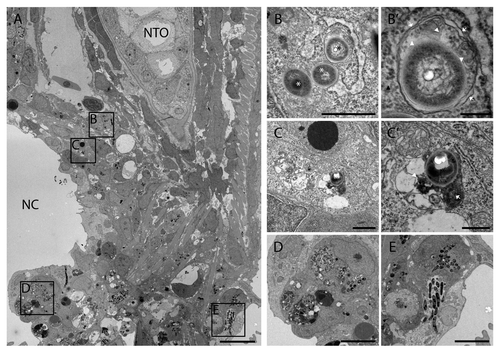
Figure 8. Quantification of intracellular M. marinum shows the distribution of bacteria in different compartments. (A–F) Representative TEM images of M. marinum in different compartments. (A) Aggregates were observed as a compact cluster of bacteria (< 5) without any electron dense areas. (B) Acidic aggregates were observed as a compact number of bacteria in a compartment having a uniform electron density between the bacteria (arrowhead) and/or electron dense regions (arrow). (C) Phagosomal compartment containing bacteria surrounded by a single membrane (arrowhead) with an electron-transparent zone (arrow), without any cytoplasmic material in the compartment. (D) Initial autophagic vacuoles containing bacteria (black asterisk), with the typical double membrane with electron-lucent cleft (arrowheads) and arrows indicating ribosomes inside (white) and outside (black) of the vacuole. Also in this image cytoplasmic bacteria are shown not enclosed by any membrane, indicated by a white asterisk. (D’) Higher magnification of the region indicated in (D), showing part of the bacteria and the vacuole in more detail. (E) Degradative autophagic vacuoles with partially degraded content (arrowhead) and other fused vacuoles (arrows). (F) Lysosomal compartment containing bacteria (asterisk) with uniform electron dense content (arrow). Near this compartment 2 autophagic vacuoles were observed indicated by AVi. (G) The fractions of intracellular M. marinum found in different compartments and free cytoplasmic M. marinum are presented in a pie chart. The bacteria for which their compartment could not be determined are indicated as ND. For this experiment 3 larvae with initial stage granulomas were used, with 3 regions for each larva at ~10 μm distance in order to prevent double counting of bacteria. In total 9 sections were analyzed containing over 2400 intracellular bacteria. Data shown are mean ± SEM. Scale bars: (A and B) 500 nm, (C and D) 250 nm, and (E and F) 1 μm.
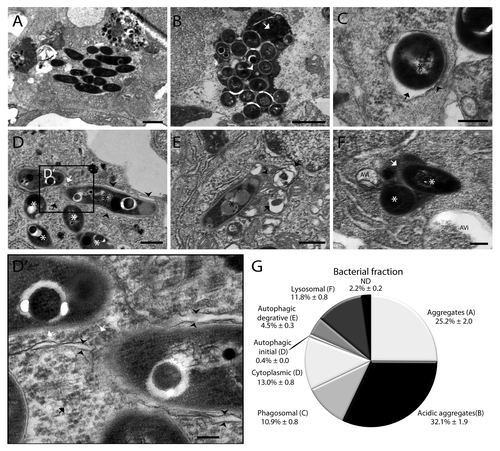
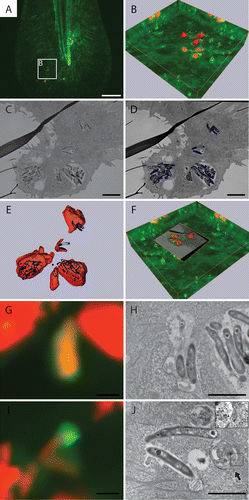
Figure 9. Correlative light and electron microscopy shows the ultrastructure of GFP-Lc3-positive structures. (A) CLSM image of infected Tg(CMV:EGFP-map1lc3b) zebrafish tail fin at 3 dpi. (B) Higher magnification of region indicated in (A), showing the projection view and the surface of the bacteria in red and of the GFP-Lc3 signal in green. (C) TEM image of the same area shown in (B). (D) Segmentation of adjacent TEM images showing the surface area of bacteria in blue. (E) Alignment of bacterial surfaces. The fluorescent signal (imaged by CLSM) is shown in red and the segmented surface (imaged by TEM) in blue. (F) 3D representation of CLSM and TEM images based on alignment shown in (E). (G) Magnified image of GFP-Lc3-positive structure enclosed 2 bacteria. (H) TEM image of the GFP-Lc3-positive compartment with bacteria shown in (G). (I) Magnified image with GFP-Lc3 signal in vicinity of bacteria. (J) TEM image of the same region, showing an initial autophagic vacuole, (indicated by arrow), at the tip of bacteria at same position as GFP-Lc3 signal in (H). The magnified inset shows the double membrane (arrowheads) and the ribosomes (asterisk) inside this vacuole. Scale bars: (A) 20 μm, (B–F) 5 μm, and (G and H) 1 μm.