Figures & data
Figure 1. RAS status does not correlate sensitivity to autophagy inhibition in NSCLC lung cell lines. (A–C) H322C, HCC4006, and Calu3 (wt RAS, indicated by filled symbols) and H358, A549, and H2009 (oncogenic KRAS mutant, indicated by unfilled symbols) NSCLC cancer cell lines were treated with varying doses of CQ and assayed by (A) MTS viability assay (72 h), (B) clonogenic growth assay as measured by crystal violet staining several days after removing CQ (72 h treatment) and adding growth media or (C) LDH release cytotoxicity assay (48 h).
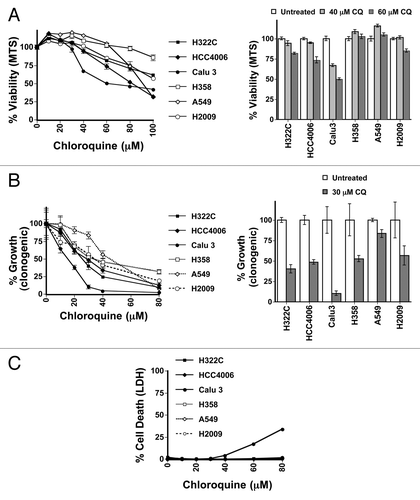
Figure 2. Neither RAS status nor TP53 status correlates with sensitivity to autophagy inhibition in NSCLC lung cell lines. (A–D) Multiple NSCLC cancer cell lines with wild-type or oncogenic RAS status as designated were treated with the indicated doses of (A and B) CQ or (C and D) BafA1 and then assayed by (A and C) MTS viability assay (72 h) or (B and D) LDH release cytotoxicity assay (72 h). *H1299 has an oncogenic mutation in NRAS instead of KRAS.
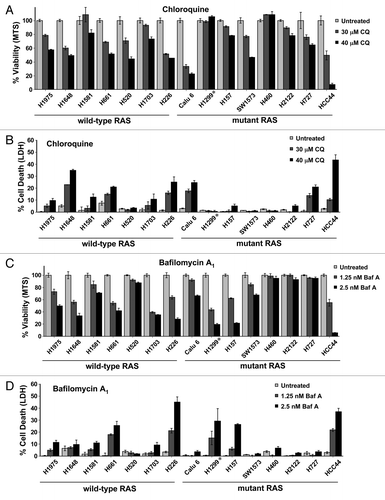
Figure 3. Acute RAS expression activates autophagy and promotes resistance to CQ in a human ovarian surface epithelial (HOSE) cell line. (A) HOSE cells with a tetracycline-inducible HRASG12V transgene (HOSE-HRASG12V) were left untreated or were treated with doxycycline (100 ng/mL) for 8 d. CQ (30 μM) was added for increasing lengths of time and then cells were lysed and immunoblotted for RAS, LC3 and ACTB to measure basal autophagy. (B) GFP-tagged LC3-expressing HOSE-HRASG12V cells that were treated or untreated with doxycyline for 6 d to induce RAS expression were analyzed for puncta formation using fluorescence microscopy. (C) HOSE-HRASG12V cells infected with tandem mCherry/GFP-LC3 retrovirus were left untreated or were treated with doxycycline (100 ng/mL) for 3 or 6 d and analyzed by flow cytometry. Some cells were treated with CQ (30 μM) overnight as a control for no flux. A rightward shift in the peak indicates increasing mCherry/GFP fluorescence ratio and thus an increase in autophagic flux. (C–F) HOSE-HRASG12V cells were left untreated or were treated with doxycycline (100 ng/mL) for 5 to 7 d. Cells were then replated and treated with doses of CQ with or without further doxycycline treatment (100 ng/mL) and cell viability and toxicity was measured by (C) MTS viability assay, (D) LDH release or (C) viability using propidium iodide exclusion as counted under a fluorescence microscope. **P < 0.01, *P < 0.05
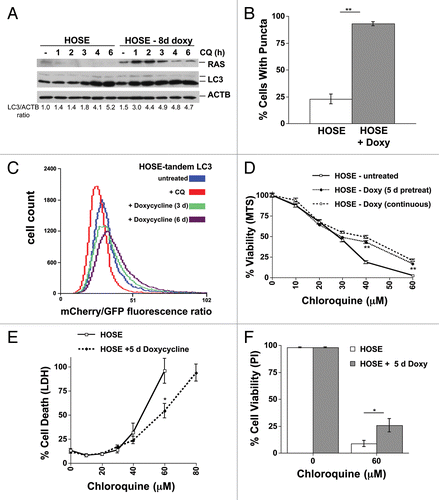
Figure 4. RAS has opposite effects on CQ sensitivity in genetically defined immortalized human skeletal muscle myoblasts (HSMM) and human embryonic kidney cells (HEK). (A–H) Immortalized HSMM (A, C, E, and G) or HEK cells (B, D, F, and H) with or without stable expression of HRASG12V were treated with CQ for 48 h and assayed by (A and B) MTS viability assay, (C and D) clonogenic growth assay as measured by crystal violet staining several days after removing the CQ and adding growth media, (E and F) LDH release cytotoxicity assay, or (G and H) propidium iodide exclusion as counted under a fluorescence microscope. **P < 0.01, *P < 0.05, #P < 0.08
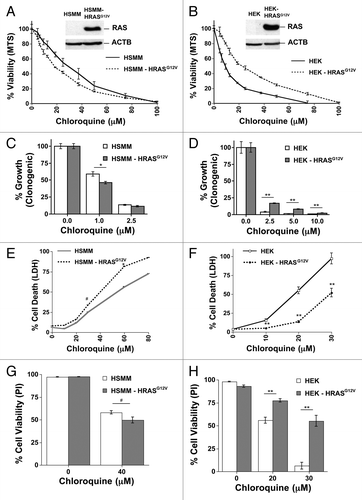
Figure 5. RAS has opposite effects on autophagy in genetically defined immortalized human skeletal muscle myoblasts (HSMM) and human embryonic kidney cells (HEK). (A and B) Immortalized HSMM (A) or HEK cells (B) with or without stable expression of HRASG12V were treated with CQ (30 μM) for the indicated time points and then cells were lysed and immunoblotted for LC3 and ACTB. (C and D) GFP tagged LC3-expressing HSMM (C) or HEK cells (D) cells with or without HRASG12V were analyzed for puncta formation using fluorescence microscopy. **P < 0.01
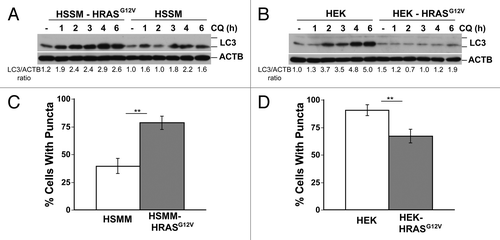
Figure 6. Oncogenic RAS expression inhibits both autophagy and CQ sensitivity human embryonic kidney cells (HEK). (A) Immortalized HEK cells infected with tandem mCherry/GFP-LC3 retrovirus, stably selected for antibiotic resistance, and sorted for high fluorescence population. Cells were then infected with a HRASG12V retrovirus or control empty vector (EV), and after growth, analyzed by flow cytometry. Some cells were treated with CQ (30 μM) overnight as a control for no flux. A leftward shift in the peak indicates decreasing mCherry/GFP fluorescence ratio and thus a decrease in autophagic flux compared with the empty vector control cells. (B) Cells from (A) were treated with CQ (30 μM) for the indicated time points and then cells were lysed and immunoblotted for LC3 and (C and D) Cells from (A) were treated with CQ for 48 h and assayed by (C) MTS viability assay and (D) LDH release. **P < 0.01, *P < 0.05
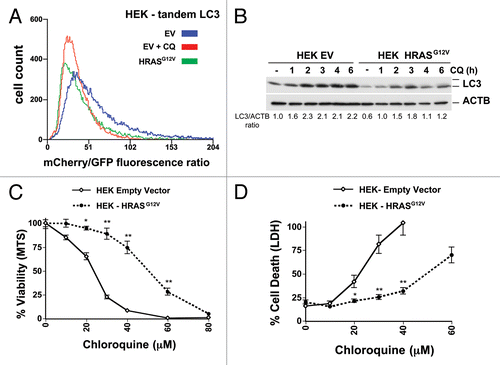
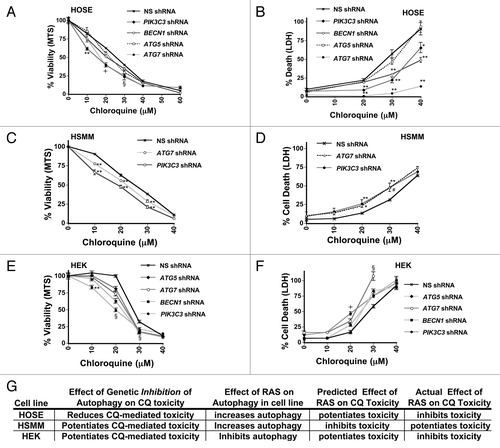
Figure 7. Genetic inhibition of autophagosome formation can potentiate or inhibit CQ- induced toxicity. HOSE (A and B), Immortalized HSMM (C and D) or HEK (E and F) cells were infected with shRNAs targeting PIK3C3, BECN1, ATG5, or ATG7, or a nonsilencing (NS) shRNA control, as indicated. These cells were treated with CQ for 48 h and assayed by MTS viability assay (left panels: A, C, and E) or LDH release cytotoxicity assay (right panels: B, D, and F). (G) Summary of the effects of RAS on autophagy and CQ toxicity are compared with the effect on CQ toxicity after inhibiting autophagosome formation using genetic means. RAS has different effects on autophagic flux and on CQ-sensitivity, but the direction of effect of RAS on autophagy does not predict whether RAS will potentiate or inhibit CQ toxicity. **P < 0.01, *P < 0.05, #P < 0.08, § for all knockdowns, P < 0.025 vs. nonsilencing control, l for all knockdowns except ATG5, P < 0.01 vs. nonsilencing control.