6,512
Views
619
CrossRef citations to date
0
Altmetric
Basic Research Paper

Characterization of autophagosome formation site by a hierarchical analysis of mammalian Atg proteins

Pages 764-776 | Published online: 16 Aug 2010

Figures & data

Figure 1 ULK1, Atg14, WIPI-1, Atg16L1 and LC3 co-localize to the same compartment, which is in close proximity to the DFCP1 structure. (A–H) Mouse embryonic fibroblasts (MEFs) stably expressing GFP-ULK1 (A), GFP-ULK1 and HA-Atg14 (B), HA-Atg14 and GFP-WIPI-1 (C), HA-WIPI-1 (D), GFP-DFCP1 (E and F), GFP-DFCP1 and HA-Atg14 (G) and GFP-DFCP1 and HA-WIPI-1 (H) were cultured in starvation medium for 1 hour. Cells were then fixed, permeabilized, and subjected to immunofluorescence microscopy using anti-HA (B, C, G and H), anti-Atg16L1 (A, D and E) and anti-LC3 antibodies (F). Due to low expression, GFP-ULK1 and GFP-DFCP1 were stained with anti-GFP antibodies. Nearly complete co-localization is indicated by arrowheads and adjacent co-localization is indicated by arrows. The structures indicated with broken lines were subjected to linescan analysis (shown in J, K and Suppl. Fig. 3). Signal color is indicated by color of typeface. St. M., starvation medium. Scale bars, 10 µm (white) and 1 µm (yellow). (I) Quantification of complete and adjacent co-localization between indicated Atg protein pairs after 1-hour starvation. Data represent mean ± SE of ten images. (J–K) Linescans were obtained from representative punctate structures showing co-localization between GFP-WIPI-1 and Atg16L1 (J) and between HA-WIPI-1 and GFP-DFCP1 (K). Original structures are shown in (D and H) (indicated with dashed lines). (L) 3D reconstruction of Atg puntate structures. 1-hour starved cells were observed by confocal laser microscopy and then 3D images were reconstituted. Lateral images reconstituted from Z-sectioning are also shown. Scale bars, 1 µm.
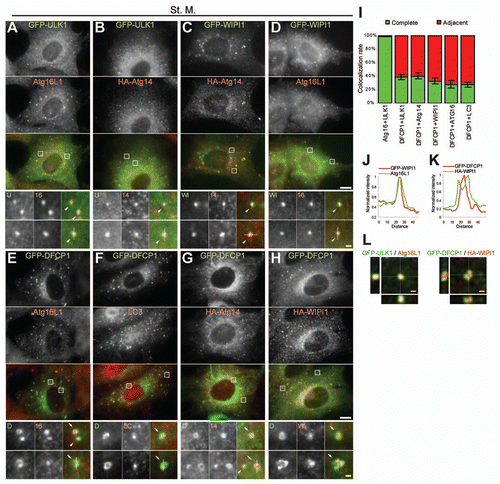
Figure 1 ULK1, Atg14, WIPI-1, Atg16L1 and LC3 co-localize to the same compartment, which is in close proximity to the DFCP1 structure. (A–H) Mouse embryonic fibroblasts (MEFs) stably expressing GFP-ULK1 (A), GFP-ULK1 and HA-Atg14 (B), HA-Atg14 and GFP-WIPI-1 (C), HA-WIPI-1 (D), GFP-DFCP1 (E and F), GFP-DFCP1 and HA-Atg14 (G) and GFP-DFCP1 and HA-WIPI-1 (H) were cultured in starvation medium for 1 hour. Cells were then fixed, permeabilized, and subjected to immunofluorescence microscopy using anti-HA (B, C, G and H), anti-Atg16L1 (A, D and E) and anti-LC3 antibodies (F). Due to low expression, GFP-ULK1 and GFP-DFCP1 were stained with anti-GFP antibodies. Nearly complete co-localization is indicated by arrowheads and adjacent co-localization is indicated by arrows. The structures indicated with broken lines were subjected to linescan analysis (shown in J, K and Suppl. Fig. 3). Signal color is indicated by color of typeface. St. M., starvation medium. Scale bars, 10 µm (white) and 1 µm (yellow). (I) Quantification of complete and adjacent co-localization between indicated Atg protein pairs after 1-hour starvation. Data represent mean ± SE of ten images. (J–K) Linescans were obtained from representative punctate structures showing co-localization between GFP-WIPI-1 and Atg16L1 (J) and between HA-WIPI-1 and GFP-DFCP1 (K). Original structures are shown in (D and H) (indicated with dashed lines). (L) 3D reconstruction of Atg puntate structures. 1-hour starved cells were observed by confocal laser microscopy and then 3D images were reconstituted. Lateral images reconstituted from Z-sectioning are also shown. Scale bars, 1 µm.

Figure 2 Localization of GFP-LC3 and endogenous Atg16L1 in Atg3 KO, Atg5 KO and FIP200 KO MEFs. Puncta formation of GFP-LC3 (A) and endogenous Atg16L1 (B) was assessed in Atg3 KO, Atg5 KO and FIP200 KO MEFs, and wortmannin-treated cells. Wild-type MEFs and MEFs deficient for Atg3, Atg5 and FIP200 stably expressing GFP-LC3 were cultured in regular or starvation medium, with or without 0.2 µM wortmannin for 2 hours. Cells were then fixed and examined by fluorescence microscopy. For Atg16L1 detection, cells were stained with anti-Atg16L1 antibodies. Scale bars, 10 µm. Graphs show the results of quantification of the dot positive cells (more than 20 dots (A) and 5 dots (B) per cell). Results shown represent mean ± SE of triplicate samples containing greater than 100 cells. Reg. M., regular medium; St. M., starvation medium; WM, wortmannin; WT, wild-type.
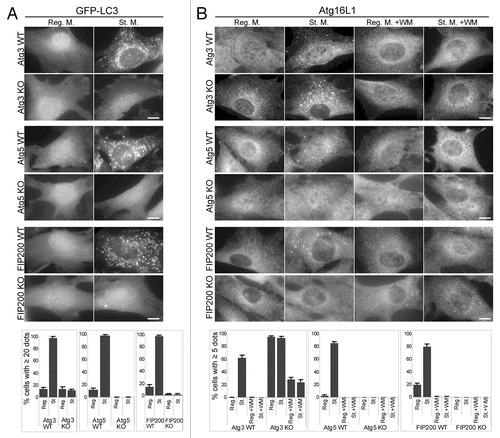
Figure 2 Localization of GFP-LC3 and endogenous Atg16L1 in Atg3 KO, Atg5 KO and FIP200 KO MEFs. Puncta formation of GFP-LC3 (A) and endogenous Atg16L1 (B) was assessed in Atg3 KO, Atg5 KO and FIP200 KO MEFs, and wortmannin-treated cells. Wild-type MEFs and MEFs deficient for Atg3, Atg5 and FIP200 stably expressing GFP-LC3 were cultured in regular or starvation medium, with or without 0.2 µM wortmannin for 2 hours. Cells were then fixed and examined by fluorescence microscopy. For Atg16L1 detection, cells were stained with anti-Atg16L1 antibodies. Scale bars, 10 µm. Graphs show the results of quantification of the dot positive cells (more than 20 dots (A) and 5 dots (B) per cell). Results shown represent mean ± SE of triplicate samples containing greater than 100 cells. Reg. M., regular medium; St. M., starvation medium; WM, wortmannin; WT, wild-type.

Figure 3 Puncta formation of the PI(3)P-binding proteins WIPI-1 and DFCP1 is defective in FIP200 KO MEFs and wortmannin-treated cells. MEFs deficient for Atg3, Atg5 and FIP200, and their corresponding wild-type control MEFs stably transformed with HA-WIPI-1 (A) or GFP-DFCP1 (B) were cultured in regular or starvation medium, with or without 0.2 µM wortmannin for 1 hour. Cells were then fixed, permeabilized, and subjected to immunofluorescence microscopy using anti-HA (A) or anti-GFP antibodies (B). Graphs show the results of quantification of dot positive cells. The Y axis indicates % cells demonstrating more than 10 dots. Results shown represent mean ± SE of triplicate samples containing greater than 100 cells. Reg. M., regular medium; St. M., starvation medium; WM, wortmannin; WT, wild-type. Scale bars, 10 µm.
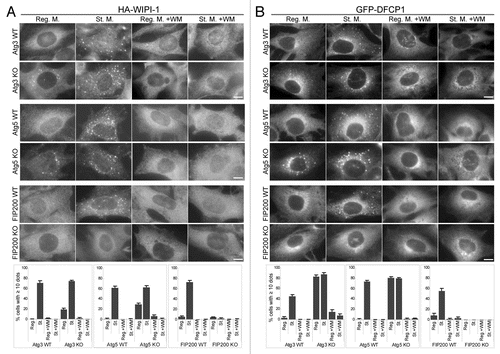
Figure 3 Puncta formation of the PI(3)P-binding proteins WIPI-1 and DFCP1 is defective in FIP200 KO MEFs and wortmannin-treated cells. MEFs deficient for Atg3, Atg5 and FIP200, and their corresponding wild-type control MEFs stably transformed with HA-WIPI-1 (A) or GFP-DFCP1 (B) were cultured in regular or starvation medium, with or without 0.2 µM wortmannin for 1 hour. Cells were then fixed, permeabilized, and subjected to immunofluorescence microscopy using anti-HA (A) or anti-GFP antibodies (B). Graphs show the results of quantification of dot positive cells. The Y axis indicates % cells demonstrating more than 10 dots. Results shown represent mean ± SE of triplicate samples containing greater than 100 cells. Reg. M., regular medium; St. M., starvation medium; WM, wortmannin; WT, wild-type. Scale bars, 10 µm.

Figure 4 Puncta formation of WIPI-1 and DFCP1 depends on Atg14 and Vps34. HepG2 cells stably expressing GFP-WIPI-1 (A) and HeLa cells stably expressing GFP-DFCP1 (B) were treated with Atg14, Vps34 or control siRNA oligos, as indicated. Cells were cultured in starvation medium for 2 hours, and then subjected to immunofluorescence microscopy using anti-GFP antibodies. Graphs show the results of quantification of the GFP dot positive cells (more than 5 dots per cell). Results shown represent mean ± SE of triplicate samples containing greater than 100 cells. *p < 0.05, **p < 0.01, Student t-test. Reg. M., regular medium; St. M., starvation medium. Scale bars, 10 µm.
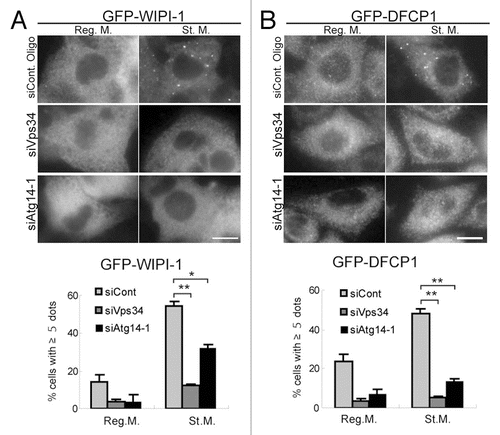
Figure 4 Puncta formation of WIPI-1 and DFCP1 depends on Atg14 and Vps34. HepG2 cells stably expressing GFP-WIPI-1 (A) and HeLa cells stably expressing GFP-DFCP1 (B) were treated with Atg14, Vps34 or control siRNA oligos, as indicated. Cells were cultured in starvation medium for 2 hours, and then subjected to immunofluorescence microscopy using anti-GFP antibodies. Graphs show the results of quantification of the GFP dot positive cells (more than 5 dots per cell). Results shown represent mean ± SE of triplicate samples containing greater than 100 cells. *p < 0.05, **p < 0.01, Student t-test. Reg. M., regular medium; St. M., starvation medium. Scale bars, 10 µm.

Figure 5 Wortmannin-resistant ULK1 and Atg14 puncta are generated in Atg3 KO and Atg5 KO cells, but not in FIP200 KO cells. (A and B) MRFs deficient for Atg3, Atg5 and FIP200, and their corresponding wild-type control MEFs, stably expressing GFP-Atg14 (A) or GFP-ULK1 (B) were cultured in regular or starvation medium with 0.2 µM wortmannin for 1 hour. Cells were then subjected to immunofluorescence microscopy using anti-GFP antibodies. Graphs show the results of quantification of the GFP dot positive cells (more than 10 dots per cell). Results shown represent mean ± SE of triplicate samples containing greater than 100 cells. Reg. M., regular medium; St. M., starvation medium; WM, wortmannin; WT, wild-type. Scale bars, 10 µm. (C) Summary of the hierarchy analysis of mammalian Atg proteins in terms of puncta formation. “+” and “−” indicate whether puncta were formed or not formed, respectively.
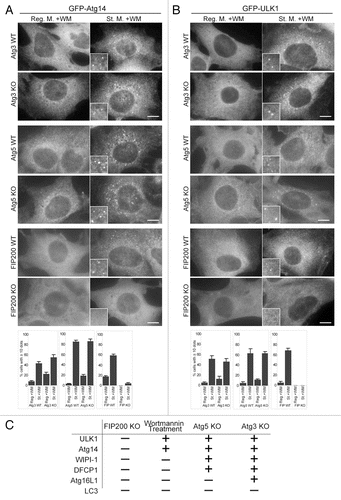
Figure 5 Wortmannin-resistant ULK1 and Atg14 puncta are generated in Atg3 KO and Atg5 KO cells, but not in FIP200 KO cells. (A and B) MRFs deficient for Atg3, Atg5 and FIP200, and their corresponding wild-type control MEFs, stably expressing GFP-Atg14 (A) or GFP-ULK1 (B) were cultured in regular or starvation medium with 0.2 µM wortmannin for 1 hour. Cells were then subjected to immunofluorescence microscopy using anti-GFP antibodies. Graphs show the results of quantification of the GFP dot positive cells (more than 10 dots per cell). Results shown represent mean ± SE of triplicate samples containing greater than 100 cells. Reg. M., regular medium; St. M., starvation medium; WM, wortmannin; WT, wild-type. Scale bars, 10 µm. (C) Summary of the hierarchy analysis of mammalian Atg proteins in terms of puncta formation. “+” and “−” indicate whether puncta were formed or not formed, respectively.

Figure 6 ULK1 puncta tightly associate with the ER membrane. (A and B) NIH3T3 cells stably expressing GFP-ULK1 (A) or Vps34-GFP (B) together with HA-Atg14 were cultured in starvation medium with 0.2 µM wortmannin for 1 hour. Cells were then fixed, permeabilized, and subjected to immunofluorescence microscopy using anti-HA and anti-GFP (for GFP-ULK1) antibodies. signal color is indicated by color of typeface. St. M., starvation medium; WM, wortmannin. Scale bars, 10 µm (white) and 1 µm (yellow). (C) MEFs stably expressing GFP-ER (containing transmembrane region of rat cytochrome b5) and HA-ULK1 were cultured in starvation medium, with or without 0.2 µM wortmannin for 1 hour, and then subjected to immunofluorescence microscopy using anti-GFP and anti-HA antibodies. (D and E) selected frames from time-lapse movies of MEFs stably expressing GFP-ULK1 and mRFP-ER in starvation medium, with (E) or without (D) 0.2 µM wortmannin are shown. The cells were imaged starting from 30 minutes (D) or 90 minutes (E) after the starvation treatment commenced. Localization of GFP-ULK1 is indicated by arrowheads. See Video 1 and 2 for whole images. Signal color is indicated by color of typeface. St. M., starvation medium; WM, wortmannin. Scale bars, 10 µm (white) and 1 µm (yellow).
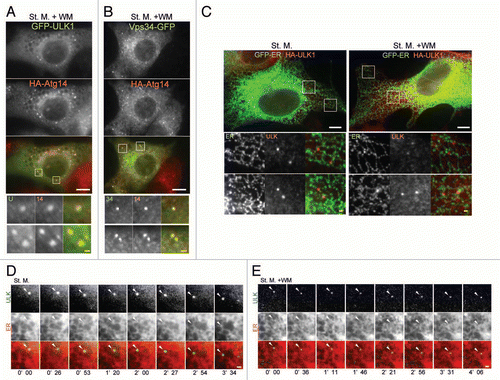
Figure 6 ULK1 puncta tightly associate with the ER membrane. (A and B) NIH3T3 cells stably expressing GFP-ULK1 (A) or Vps34-GFP (B) together with HA-Atg14 were cultured in starvation medium with 0.2 µM wortmannin for 1 hour. Cells were then fixed, permeabilized, and subjected to immunofluorescence microscopy using anti-HA and anti-GFP (for GFP-ULK1) antibodies. signal color is indicated by color of typeface. St. M., starvation medium; WM, wortmannin. Scale bars, 10 µm (white) and 1 µm (yellow). (C) MEFs stably expressing GFP-ER (containing transmembrane region of rat cytochrome b5) and HA-ULK1 were cultured in starvation medium, with or without 0.2 µM wortmannin for 1 hour, and then subjected to immunofluorescence microscopy using anti-GFP and anti-HA antibodies. (D and E) selected frames from time-lapse movies of MEFs stably expressing GFP-ULK1 and mRFP-ER in starvation medium, with (E) or without (D) 0.2 µM wortmannin are shown. The cells were imaged starting from 30 minutes (D) or 90 minutes (E) after the starvation treatment commenced. Localization of GFP-ULK1 is indicated by arrowheads. See Video 1 and 2 for whole images. Signal color is indicated by color of typeface. St. M., starvation medium; WM, wortmannin. Scale bars, 10 µm (white) and 1 µm (yellow).

Figure 7 VMP1 localizes to the early autophagic structure. (A and C–E) MEFs stably expressing VMP1-GFP and RFP-ER or HA-ULK1 were cultured in regular or starvation medium, with or without 0.2 µM wortmannin for 1 hour. Cells were subjected to immunofluorescence microscopy using anti-HA antibodies. Colocalization between VMP1 and ULK1 is indicated by arrowheads. (B) MEFs stably expressing VMP1-GFP were cultured in regular medium and subjected to subcellular fractionation as described in Materials and Methods. Immunoblot analysis showed the distribution of VMP1-GFP, Beclin 1, protein disulfide isomerase (PDI, ER marker), syntaxin 6 (Golgi marker) and HSP90 (cytoplasmic protein marker). (F) Graph shows the result of quantification of colocalization between VMP1 and ULK1. The Y axis indicates VMP1-positivity (%) of the ULK1 puncta. Results shown represent mean ± SE of 10 cells. *p < 0.01, Student's t-test. (G) Wild-type and FIP200 KO MEFs stably expressing VMP1-GFP were observed under nutrient-rich conditions. (H) HeLa cells stably expressing HA-ULK1, GFP-WIPI-1 and GFP-DFCP1 were treated with VMP1 or control siRNA oligos. Cells were cultured in starvation medium for 1 hour, and then subjected to immunofluorescence microscopy using anti-HA, anti-GFP and anti-Atg16L1 antibodies. signal color (A and C–E) is indicated by color of typeface. Reg. M., regular medium; St. M., starvation medium; WM, wortmannin. Scale bars, 10 µm (white) and 1 µm (yellow). (I) HeLa cells were treated with VMP1 or control siRNA oligos, as indicated. Cells were cultured in starvation medium for 2 hours with or without 20 mM choloroquine and then starvation-induced p62 degradation and lysosomes-dependent LC3 turnover was determined by immunblot analysis.
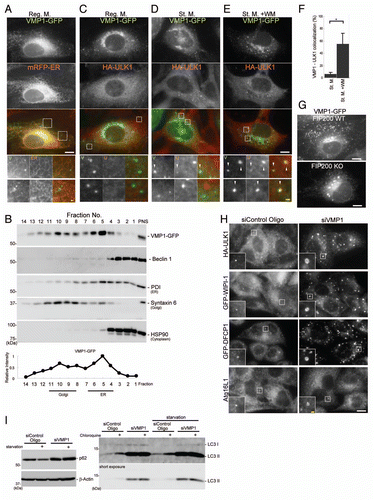
Figure 7 VMP1 localizes to the early autophagic structure. (A and C–E) MEFs stably expressing VMP1-GFP and RFP-ER or HA-ULK1 were cultured in regular or starvation medium, with or without 0.2 µM wortmannin for 1 hour. Cells were subjected to immunofluorescence microscopy using anti-HA antibodies. Colocalization between VMP1 and ULK1 is indicated by arrowheads. (B) MEFs stably expressing VMP1-GFP were cultured in regular medium and subjected to subcellular fractionation as described in Materials and Methods. Immunoblot analysis showed the distribution of VMP1-GFP, Beclin 1, protein disulfide isomerase (PDI, ER marker), syntaxin 6 (Golgi marker) and HSP90 (cytoplasmic protein marker). (F) Graph shows the result of quantification of colocalization between VMP1 and ULK1. The Y axis indicates VMP1-positivity (%) of the ULK1 puncta. Results shown represent mean ± SE of 10 cells. *p < 0.01, Student's t-test. (G) Wild-type and FIP200 KO MEFs stably expressing VMP1-GFP were observed under nutrient-rich conditions. (H) HeLa cells stably expressing HA-ULK1, GFP-WIPI-1 and GFP-DFCP1 were treated with VMP1 or control siRNA oligos. Cells were cultured in starvation medium for 1 hour, and then subjected to immunofluorescence microscopy using anti-HA, anti-GFP and anti-Atg16L1 antibodies. signal color (A and C–E) is indicated by color of typeface. Reg. M., regular medium; St. M., starvation medium; WM, wortmannin. Scale bars, 10 µm (white) and 1 µm (yellow). (I) HeLa cells were treated with VMP1 or control siRNA oligos, as indicated. Cells were cultured in starvation medium for 2 hours with or without 20 mM choloroquine and then starvation-induced p62 degradation and lysosomes-dependent LC3 turnover was determined by immunblot analysis.

Figure 8 Model of autophagosome formation and hierarchical relationship among mammalian autophagy proteins. At the initial step, the ULK1 and Atg14 complexes localize to the autophagosome formation sites, which are on or in close proximity to the ER. VMP1 also transiently associates with this structure. Wortmannin treatment causes accumulation of the ULK1-Atg14-VMP1 structures, suggesting that dissociation, but not formation, of this structure depends on PI3-kinase activity. Downstream of this step, the two PI(3)P binding proteins WIPI-1 and DFCP1, the Atg12-Atg5-Atg16L1 complex and LC3-PE function to appropriately elongate the isolation membrane. The arrows indicate interdependency among the mammalian Atg proteins for puncta formation.
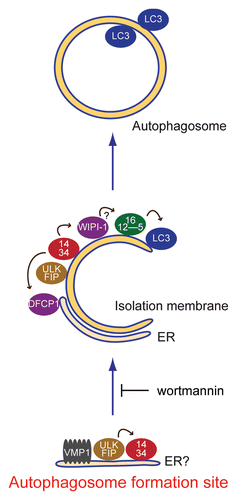
Figure 8 Model of autophagosome formation and hierarchical relationship among mammalian autophagy proteins. At the initial step, the ULK1 and Atg14 complexes localize to the autophagosome formation sites, which are on or in close proximity to the ER. VMP1 also transiently associates with this structure. Wortmannin treatment causes accumulation of the ULK1-Atg14-VMP1 structures, suggesting that dissociation, but not formation, of this structure depends on PI3-kinase activity. Downstream of this step, the two PI(3)P binding proteins WIPI-1 and DFCP1, the Atg12-Atg5-Atg16L1 complex and LC3-PE function to appropriately elongate the isolation membrane. The arrows indicate interdependency among the mammalian Atg proteins for puncta formation.
Supplemental material

Additional material

Download Zip (1.9 MB)