Figures & data
Figure 1. Transient changes in Ca2+ dynamics after starvation correlate with changes of the LC3-II levels. (A) Measurements of cytosolic Ca2+ signals, displayed as normalized Fura-2 ratio (R/R0), showing the effect of 1 µM thapsigargin (TG) or 10 µM ionomycin in intact HeLa cells with (2, 3, 5 h) or without (0 h) starvation. Representative recordings of the Fura-2 ratio after addition of TG (left panel) or ionomycin (right panel) in cells pretreated with HBSS for 0, 2, 3 or 5 h are shown. Forty-five seconds prior to addition of TG or ionomycin, EGTA (3 mM) was given as indicated. (B) Measurements of cytosolic Ca2+ signals, displayed as normalized Fura-2 ratio (R/R0), after addition of 0.3 µM (left panel) or 100 µM (right panel) ATP in intact HeLa cells with (2, 3, 5 h) or without (0 h) starvation. (C) Representative LC3-II western blots of HeLa cells starved for the indicated time period (0–7 h). (D) GFP-LC3-puncta formation in HeLa cells transfected with GFP-LC3 constructs. Cells were starved (3 h or 5 h) or not (0 h), as indicated. Left: Representative pictures. The scale bar represents 20 µm. Right: Quantification of autophagic cells. Only cells displaying more than 10 puncta were considered autophagic (n = 3). (E) Analysis of XBP-1-mRNA splicing in cells pretreated with HBSS (0–5 h) or 2 µg/ml tunicamycin (TM; 24 h, 48 h); uXBP-1 = unspliced XBP-1; sXBP-1 = spliced XBP-1. (F) Representative caspase 3 western blots of HeLa cells starved for the indicated time (0–5 h) or treated with 1 µM staurosporine (STS) for 5 h. (G) XTT-assay for measurement of cell viability, after incubation in HBSS for the indicated time period or treatment with 1 µM staurosporine for 5 h (n = 4). The cell viability is expressed as the absorbance at 490 nm minus the absorbance at 630 nm (A490-A630). *p < 0.05; **p < 0.01 (paired t-test).
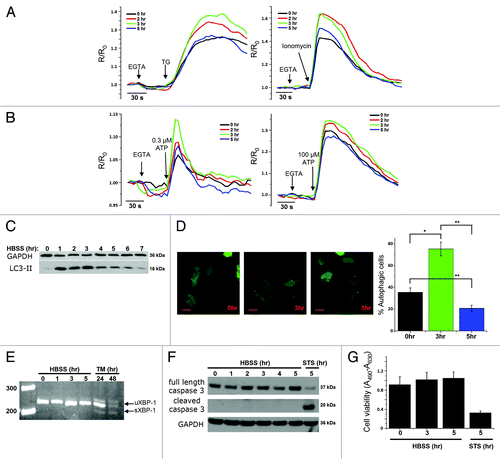
Figure 2. Increased Ca2+-store content caused by upregulation of Ca2+-binding proteins (CaBP) and decreased ER Ca2+-leak rate during starvation. (A) Fura-2 measurements, calibrated for [Ca2+]cyt in HeLa cells with (3 h) or without (0 h) starvation, after addition of 1 µM TG (left) or 10 µM ionomycin (right). (B) Quantitative analysis of the increase of [Ca2+]cyt (Δ[Ca2+]cyt; assessed by subtracting resting value from peak value) after addition of TG (left) or ionomycin (right) in cells with (3 h) or without (0 h) starvation (n = 7). (C) Unidirectional 45Ca2+-flux experiments in permeabilized cells pretreated with (3 h) or without (0 h) HBSS. Left: Ca2+ content is shown as a function of time of efflux. The single arrow indicates the addition of 10 µM A23187 (triangles); the double arrow represents the amount of Ca2+ released by A23187. Right: Quantification of the Ca2+ released by A23187 (n = 8). (D) Western blot analysis of SERCA2b from lysates of cells pretreated with HBSS for 0, 1, 3 or 5 h. Upper: Representative blots. Lower: Quantitative analysis of protein/GAPDH ratio normalized to control (0 h) conditions (n = 4). (E) Western blot analysis for CaBP proteins: Grp78/BiP (left) and calreticulin. (F) Decrease in ER Ca2+ content as a function of time in permeabilized cells pretreated with (3 h) or without (0 h) HBSS. Traces were normalized and expressed as percentage of the initial Ca2+ content. The ER Ca2+-leak rate is presented as the decline of the ER 45Ca2+-store content as a function of time plotted on a logarithmic scale (n = 4). *p < 0.05; **p < 0.01; ***p < 0.001 (paired t-test).
![Figure 2. Increased Ca2+-store content caused by upregulation of Ca2+-binding proteins (CaBP) and decreased ER Ca2+-leak rate during starvation. (A) Fura-2 measurements, calibrated for [Ca2+]cyt in HeLa cells with (3 h) or without (0 h) starvation, after addition of 1 µM TG (left) or 10 µM ionomycin (right). (B) Quantitative analysis of the increase of [Ca2+]cyt (Δ[Ca2+]cyt; assessed by subtracting resting value from peak value) after addition of TG (left) or ionomycin (right) in cells with (3 h) or without (0 h) starvation (n = 7). (C) Unidirectional 45Ca2+-flux experiments in permeabilized cells pretreated with (3 h) or without (0 h) HBSS. Left: Ca2+ content is shown as a function of time of efflux. The single arrow indicates the addition of 10 µM A23187 (triangles); the double arrow represents the amount of Ca2+ released by A23187. Right: Quantification of the Ca2+ released by A23187 (n = 8). (D) Western blot analysis of SERCA2b from lysates of cells pretreated with HBSS for 0, 1, 3 or 5 h. Upper: Representative blots. Lower: Quantitative analysis of protein/GAPDH ratio normalized to control (0 h) conditions (n = 4). (E) Western blot analysis for CaBP proteins: Grp78/BiP (left) and calreticulin. (F) Decrease in ER Ca2+ content as a function of time in permeabilized cells pretreated with (3 h) or without (0 h) HBSS. Traces were normalized and expressed as percentage of the initial Ca2+ content. The ER Ca2+-leak rate is presented as the decline of the ER 45Ca2+-store content as a function of time plotted on a logarithmic scale (n = 4). *p < 0.05; **p < 0.01; ***p < 0.001 (paired t-test).](/cms/asset/5ec2d4ab-5051-4692-aa21-ce1415158a16/kaup_a_10917909_f0002.gif)
Figure 3. Sensitization of the Ins(1,4,5)P3R toward Ins(1,4,5)P3 during starvation. (A) Mean traces of Fura-2 measurements, calibrated for [Ca2+]cyt in HeLa cells with (3 h) or without (0 h) starvation, after addition of 0.3 µM (full line) or 100 µM (dashed line) ATP. (B) Quantitative analysis of the increase of [Ca2+]cyt (Δ[Ca2+]cyt; assessed by subtracting resting value from peak value) after addition of 0.3 µM (left) or 100 µM (right) ATP (n = 7). (C) Unidirectional 45Ca2+-flux experiments in permeabilized cells pretreated with (3 h) or without (0 h) HBSS. Mean fractional 45Ca2+ release (%/2 min) is shown as a function of time. The effect of 0.7 µM Ins(1,4,5)P3 (circles), 10 µM A23187 (triangles) or no addition (squares) are shown. The arrow indicates the addition of Ins(1,4,5)P3 or A23187. (D) Quantitative analysis of the Ins(1,4,5)P3-induced 45Ca2+ release relative to the A23187-induced 45Ca2+ release for the indicated concentrations of Ins(1,4,5)P3 in cells pretreated with (3 h) or without (0 h) HBSS (n = 8). **p < 0.01; N.S. not significant (paired t-test).
![Figure 3. Sensitization of the Ins(1,4,5)P3R toward Ins(1,4,5)P3 during starvation. (A) Mean traces of Fura-2 measurements, calibrated for [Ca2+]cyt in HeLa cells with (3 h) or without (0 h) starvation, after addition of 0.3 µM (full line) or 100 µM (dashed line) ATP. (B) Quantitative analysis of the increase of [Ca2+]cyt (Δ[Ca2+]cyt; assessed by subtracting resting value from peak value) after addition of 0.3 µM (left) or 100 µM (right) ATP (n = 7). (C) Unidirectional 45Ca2+-flux experiments in permeabilized cells pretreated with (3 h) or without (0 h) HBSS. Mean fractional 45Ca2+ release (%/2 min) is shown as a function of time. The effect of 0.7 µM Ins(1,4,5)P3 (circles), 10 µM A23187 (triangles) or no addition (squares) are shown. The arrow indicates the addition of Ins(1,4,5)P3 or A23187. (D) Quantitative analysis of the Ins(1,4,5)P3-induced 45Ca2+ release relative to the A23187-induced 45Ca2+ release for the indicated concentrations of Ins(1,4,5)P3 in cells pretreated with (3 h) or without (0 h) HBSS (n = 8). **p < 0.01; N.S. not significant (paired t-test).](/cms/asset/b3d3608f-21ff-44df-a654-9f33221334d3/kaup_a_10917909_f0003.gif)
Figure 4. Beclin 1 binding to Ins(1,4,5)P3Rs is enhanced during starvation and directly targets the suppressor domain. (A) Co-immunoprecipitation experiments of Beclin 1 with Ins(1,4,5)P3R1 and Ins(1,4,5)P3R3 from lysates of HeLa cells pretreated with (3 h) or without (0 h) HBSS. Representative blots are shown of co-immunoprecipitation experiments with Ins(1,4,5)P3R1 and Ins(1,4,5)P3R3 and immunoblot for Beclin 1 (upper four panels). IgG = negative control (samples of both 0 h and 3 h were analyzed with the same result); IN = input. The double lines indicate that the lanes were taken from another part of the same gel. Lower three panels represent the levels of the indicated proteins analyzed by western blotting. (B) Quantitative analysis of the Beclin 1/Ins(1,4,5)P3R1 (upper) or Beclin 1/Ins(1,4,5)P3R3 (lower) ratio in the immunoprecipitate in samples where binding in basal conditions was detectable (n = 3). (C) Representative co-immunoprecipitation experiment of Beclin 1 with Ins(1,4,5)P3R1 from lysates of HeLa cells starved (3 h or 5 h) or not (0 h). IgG = negative control; IN = input. Lower three panels represent the levels of the indicated proteins analyzed by western blotting analysis. (D) Pull-down experiments with GST-fused domains of Ins(1,4,5)P3R1 and Ins(1,4,5)P3R3 and purified Beclin 1. Ligand-binding domain (1–604); suppressor domain (1–225); Ins(1,4,5)P3-binding core (226–604). Representative example is shown of a pull-down experiment. The GST-fusion proteins were visualized with SYPRO Orange, while Beclin 1 was detected using anti-Beclin 1. The asterisks indicate the intact GST-Ins(1,4,5)P3R fragments. The double lines indicate that the lanes were taken from another part of the same gel. A Beclin 1 degradation product can be observed in some lanes, as is indicated by the arrow. IN = input. (E) Comparative analysis of the amount of Beclin 1 present in the pull-down experiments, normalized to control conditions (GST) (n = 4). *p < 0.05 (paired t-test).
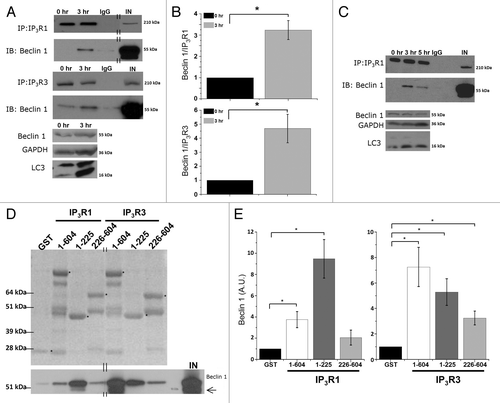
Figure 5. siRNA-mediated knockdown of Beclin 1, but not of Atg5, abolishes starvation-induced sensitization of Ins(1,4,5)P3R. (A) Western blot analysis of indicated proteins in HeLa cells treated with indicated siRNA duplexes. (B) Unidirectional 45Ca2+-flux experiments in siRNA-treated permeabilized cells pretreated with (3 h) or without (0 h) HBSS. During the experiment cells were exposed to 0.7 µM Ins(1,4,5)P3 (circles) or 10 µM A23187 (triangles). The arrows indicate the addition of Ins(1,4,5)P3 or A23187. Representative traces are shown of fractional 45Ca2+ release (%/2 min) as a function of time in cells treated with siRNA against BECN1 siBECN-1 1. (C) Unidirectional 45Ca2+-flux experiments in control siRNA (siCtrl)-treated cells. (D) Unidirectional 45Ca2+-flux experiments in siRNA-treated cells against ATG5 (siAtg5). (E) Quantitative analysis of the Ins(1,4,5)P3-induced 45Ca2+ release relative to the A23187-induced 45Ca2+ release in cells pretreated with (3 h) or without (0 h) HBSS (n = 4). *p < 0.05; **p < 0.01; N.S. not significant (paired t-test).
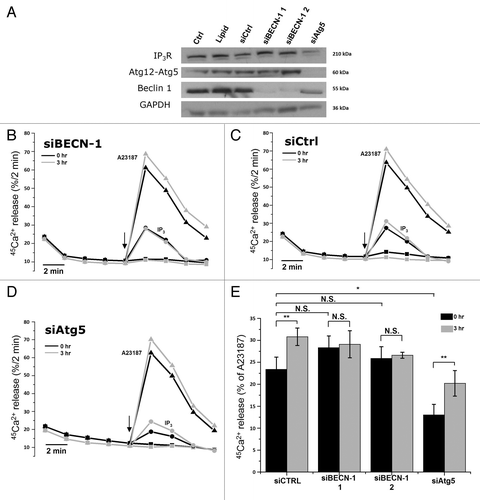
Figure 6. Purified Beclin 1 directly sensitizes the Ins(1,4,5)P3R toward Ins(1,4,5)P3, independently of Bcl-2. (A) Unidirectional 45Ca2+-flux experiments in permeabilized HeLa cells with (gray; Beclin 1) or without (black; Ctrl) the addition of 2.5 µM purified Beclin 1. Mean fractional 45Ca2+ release (%/2 min) as a function of time is shown in the absence or presence of 2.5 µM purified Beclin 1, added for 4 min, starting 2 min prior to the addition of 0.7 (circles) or 30 µM Ins(1,4,5)P3 (triangles). The arrow indicates the addition of Ins(1,4,5)P3. (B) Quantification of the 45Ca2+ release triggered by the indicated concentration of Ins(1,4,5)P3, normalized to control conditions (n = 4). (C) Mean traces of unidirectional 45Ca2+-flux experiments in permeabilized HeLa cells without (black; Ctrl) or with 10 µM purified Beclin 1 domains (N-BH3: red; CCD: green; ECD-C: blue), added for 4 min, starting 2 min prior to the addition of 0.7 µM Ins(1,4,5)P3. The arrow indicates the addition of Ins(1,4,5)P3. (D) Quantification of the 45Ca2+ release triggered by 0.7 µM Ins(1,4,5)P3, normalized to control conditions, after addition of the indicated Beclin 1 domains (n = 4). (E) Representative example of pull-down experiments with GST-fused domains of Ins(1,4,5)P3R1 and purified Beclin 1-F123A. The GST-fusion proteins were visualized using SYPRO Orange, while Beclin 1 was detected using anti-Beclin 1. IN = input. The asterisks indicate the different domains: ligand-binding domain (1–604); suppressor domain (1–225); Ins(1,4,5)P3-binding core (226–604). (F) Representative unidirectional 45Ca2+-flux experiment in permeabilized cells with (gray; Beclin 1-F123A) or without (black; Ctrl) 2.5 µM purified Beclin 1-F123A added for 4 min, starting 2 min prior to the addition of 0.7 µM Ins(1,4,5)P3 (circles). The arrow indicates the addition of Ins(1,4,5)P3. (G) Representative co-immunoprecipitation experiment of Beclin 1-F123A with Ins(1,4,5)P3R1 from lysates of HeLa cells transfected with Beclin 1-F123A and pretreated with (3 h) or without (0 h) HBSS. IgG = negative control; IN = Input. (H) Representative co-immunoprecipitation experiment of Beclin 1 with Bcl-2 from lysates of HeLa cells transfected with Beclin 1 and pretreated with (3 or 5 h) or without (0 h) HBSS. IgG = negative control; IN = Input. *p < 0.05; **p < 0.01; N.S. not significant (paired t-test).
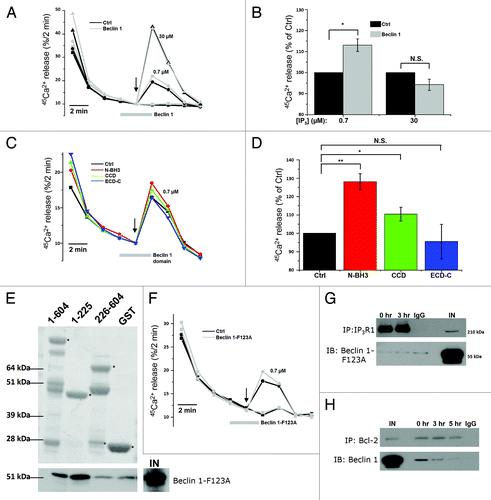
Figure 7. Intracellular Ca2+ and Ins(1,4,5)P3Rs are requisite for starvation-induced autophagy. (A) LC3 western blotting in HeLa cells treated without (Ctrl) or with HBSS for 3 h, 10 µM BAPTA-AM or both (BAPTA + HBSS). One hour before collecting cells, 100 nM Baf A1 was added. Cells were given BAPTA-AM for 30 min, then washed with complete cell culture medium (DMEM) as the control or HBSS and incubated for 3 h before collecting. Left: Representative blots. Right: Quantification of LC3-II/GAPDH ratio, normalized to control conditions (n = 4). (B) GFP-LC3-puncta formation in HeLa cells transfected with GFP-LC3 constructs. Cells were treated without (0 h) or with HBSS (3 h), and without (Ctrl) or with 10 µM BAPTA-AM (BAPTA). Left: Representative pictures. The scale bar represents 20 µm. Right: Quantification of autophagic cells. Only cells displaying more than 10 puncta were considered autophagic (n = 3). Similar results were obtained when the number of GFP-LC3 puncta were quantified. (C) LC3 western blotting in cells treated without (Ctrl) or with HBSS for 3 h, 2 µM XeB or both (XeB + HBSS). One hour before collecting cells, 100 nM Baf A1 was added. Left: Representative blots. Right: Quantification of LC3-II/GAPDH ratio, normalized to control conditions (n = 5). (D) GFP-LC3-puncta formation in HeLa cells transfected with GFP-LC3 constructs. Cells were treated without (0 h) or with HBSS (3 h), and without (Ctrl) or with 2 µM XeB. Left: Representative pictures. The scale bar represents 20 µm. Right: Quantification of autophagic cells. Only cells displaying more than 10 puncta were considered autophagic (n = 3). *p < 0.05; **p < 0.01; N.S. not significant (paired t-test).
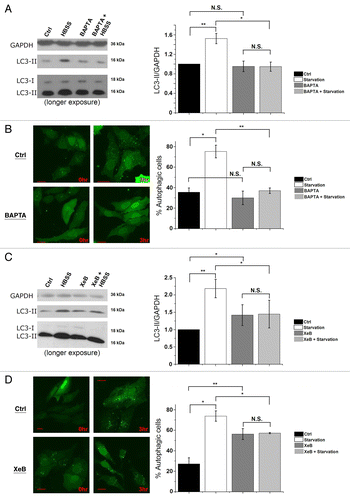
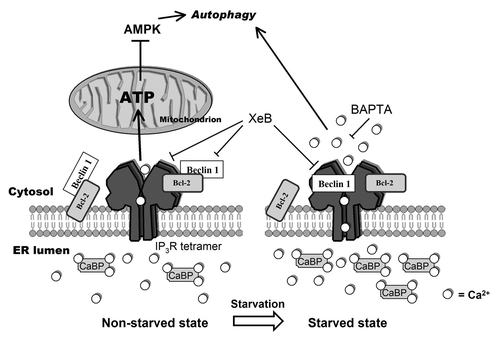
Figure 8. Model representing changes in the Ca2+ signalosome during starvation. In the non-starved state (left) Ins(1,4,5)P3Rs inhibit autophagy through a Ca2+ signal in the ER-mitochondria microdomains to fuel mitochondrial energetics, thereby inhibiting AMPK and autophagy.Citation26 In this situation, Beclin 1 likely is kept at the ER in the proximity of the Ins(1,4,5)P3R through ER-localized Bcl-2. Alternatively, there may be a scaffolding role for Ins(1,4,5)P3R/Bcl-2 complexes capturing Beclin 1.Citation31 During starvation (right), however, an upregulation of Ca2+-binding proteins (CaBP) together with the direct binding of Beclin 1 to Ins(1,4,5)P3R’s ligand-binding domain, underpins a sensitized Ca2+ signaling through Ins(1,4,5)P3Rs, leading to autophagy stimulation. The target of this Ca2+ signal is probably cytosolic. While Bcl-2 is essential for facilitating Ins(1,4,5)P3R-Beclin 1 complex formation in a cellular context, the mechanism by which Beclin 1 sensitizes Ins(1,4,5)P3R activity is direct and does not involve Bcl-2. We propose that upon starvation Beclin 1 at the ER shuttles from Bcl-2 to the Ins(1,4,5)P3R.
