3,198
Views
130
CrossRef citations to date
0
Altmetric
Review

Autophagy in protists

, , , , , , , , , , , , , , , , & show all
Pages 127-158 | Received 08 Jun 2010, Accepted 02 Aug 2010, Published online: 01 Feb 2011

Figures & data

Figure 1 Schematic overview of autophagy-related processes. The main steps of the various pathways, as summarized in the main text of the paper, are indicated. Proteins shown to be specifically required for the different pathways are boxed.
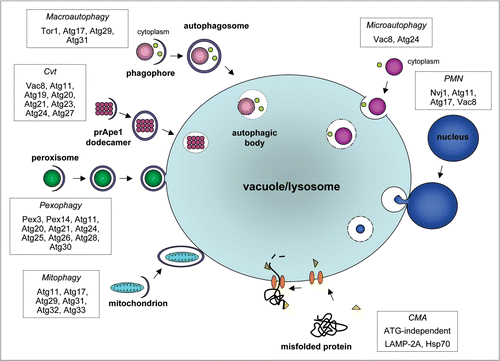
Figure 1 Schematic overview of autophagy-related processes. The main steps of the various pathways, as summarized in the main text of the paper, are indicated. Proteins shown to be specifically required for the different pathways are boxed.

Figure 2 Predicted distribution of ATG orthologues in protists. Modified from Rigden et al.Citation14 BLAST and PSI-BLAST were used to identify sequences in protists that were either homologous or putatively orthologous to known autophagy components. Proteins are grouped according to the stage of autophagy at which they principally function (see ). RPS-BLAST and HHSEARCH were used to check the domain composition of identified hits. Putative orthologues were those corresponding to the query by being reciprocal top hits in BLASTs between complete sets of predicted genome-encoded proteins and by bearing similar domain composition. By this definition there can clearly be only a single orthologue per genome. Additional putative paralogues were defined as further protist hits in the same BLAST searches, which also retrieved the query in top place and had appropriate domain composition. Black cells indicate the presence of a putative orthologue identified using a yeast Atg query; red, a putative orthologue identified using a non-yeast ATG query; light grey, homologous sequences detected using a yeast Atg query (but without indications of orthology from reciprocal BLAST results and domain composition; reviewed in ref. Citation14 for details); yellow, homologous sequences detected using a non-yeast ATG query; blank, no homologues detected. Numbers denote additional predicted paralogues in an individual species. The figure, for consistency, comes from a uniform and purely computational analysis, and does not necessarily reflect experimental information. However, experimental data suggest that some of the putative paralogues in this figure have apparently very similar functions to the confirmed orthologues' functions. For example, T. brucei, by this methodological definition, contains one predicted orthologue and three paralogues of S. cerevisiae Tor1/Tor2. Nevertheless, experimental data show that two T. brucei proteins have TOR activityCitation116 and therefore, by some definitions based on functional analysis (see text), may both be considered as orthologues. Asterisks indicate the presence of homologous sequences that could not be reliably predicted as paralogous or not. Accepted relationships within eukaryotic ‘supergroups’ for the protists surveyed here are shown. There are competing hypotheses for how the divergence of these supergroups relates to the root of eukaryotic evolution. The last common ancestor of all eukaryotes has been suggested to have existed at the point of unikont-bikont divergence.Citation199 Alternatively, although molecular and morphological evidence for the monophyly of Excavata exist (e.g., reviewed in ref. Citation60), these data are equivocal and several excavate groups continue to be proposed as extant descendants from the earliest diverging eukaryotic lineage.Citation52,Citation59 Abbreviations for eukaryotic ‘supergroups’: A, Amoebozoa; C, Chromalveolata; E, Excavata; O, Opisthokonta; P, Plantae. Abbreviations for other groupings: ch, choanoflagellates; f, fungi. The choanoflagellates represent the closest known unicellular relatives of animals. Species abbreviations: Ch, Cryptosporidium hominis; Cm, Cyanidioschyzon merolae; Cr, Chlamydomonas reinhardtii; Dd, Dictyostelium discoideum; Ec, Encephalitozoon cuniculi; Eh, Entamoeba histolytica; Gl, Giardia lamblia; Mb, Monosiga brevicolis; Ospp., Ostreococcus species; Pf, Plasmodium falciparum; Pspp., Phytophthora species; Pt, Paramecium tetraurelia; Sc, Saccharomyces cerevisiae; Tb, Trypanosoma brucei; Tp, Thalassiosira pseudonana; Tspp., Theileria species; Tt Tetrahymena thermophila; Tv, Trichomonas vaginalis.
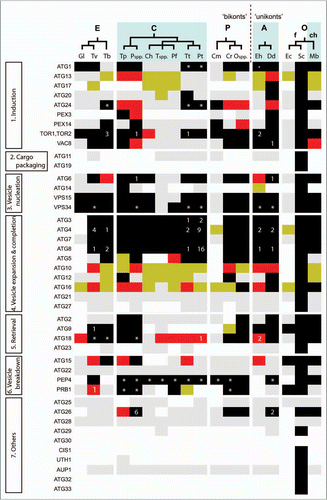
Figure 2 Predicted distribution of ATG orthologues in protists. Modified from Rigden et al.Citation14 BLAST and PSI-BLAST were used to identify sequences in protists that were either homologous or putatively orthologous to known autophagy components. Proteins are grouped according to the stage of autophagy at which they principally function (see Fig. 1). RPS-BLAST and HHSEARCH were used to check the domain composition of identified hits. Putative orthologues were those corresponding to the query by being reciprocal top hits in BLASTs between complete sets of predicted genome-encoded proteins and by bearing similar domain composition. By this definition there can clearly be only a single orthologue per genome. Additional putative paralogues were defined as further protist hits in the same BLAST searches, which also retrieved the query in top place and had appropriate domain composition. Black cells indicate the presence of a putative orthologue identified using a yeast Atg query; red, a putative orthologue identified using a non-yeast ATG query; light grey, homologous sequences detected using a yeast Atg query (but without indications of orthology from reciprocal BLAST results and domain composition; reviewed in ref. Citation14 for details); yellow, homologous sequences detected using a non-yeast ATG query; blank, no homologues detected. Numbers denote additional predicted paralogues in an individual species. The figure, for consistency, comes from a uniform and purely computational analysis, and does not necessarily reflect experimental information. However, experimental data suggest that some of the putative paralogues in this figure have apparently very similar functions to the confirmed orthologues' functions. For example, T. brucei, by this methodological definition, contains one predicted orthologue and three paralogues of S. cerevisiae Tor1/Tor2. Nevertheless, experimental data show that two T. brucei proteins have TOR activityCitation116 and therefore, by some definitions based on functional analysis (see text), may both be considered as orthologues. Asterisks indicate the presence of homologous sequences that could not be reliably predicted as paralogous or not. Accepted relationships within eukaryotic ‘supergroups’ for the protists surveyed here are shown. There are competing hypotheses for how the divergence of these supergroups relates to the root of eukaryotic evolution. The last common ancestor of all eukaryotes has been suggested to have existed at the point of unikont-bikont divergence.Citation199 Alternatively, although molecular and morphological evidence for the monophyly of Excavata exist (e.g., reviewed in ref. Citation60), these data are equivocal and several excavate groups continue to be proposed as extant descendants from the earliest diverging eukaryotic lineage.Citation52,Citation59 Abbreviations for eukaryotic ‘supergroups’: A, Amoebozoa; C, Chromalveolata; E, Excavata; O, Opisthokonta; P, Plantae. Abbreviations for other groupings: ch, choanoflagellates; f, fungi. The choanoflagellates represent the closest known unicellular relatives of animals. Species abbreviations: Ch, Cryptosporidium hominis; Cm, Cyanidioschyzon merolae; Cr, Chlamydomonas reinhardtii; Dd, Dictyostelium discoideum; Ec, Encephalitozoon cuniculi; Eh, Entamoeba histolytica; Gl, Giardia lamblia; Mb, Monosiga brevicolis; Ospp., Ostreococcus species; Pf, Plasmodium falciparum; Pspp., Phytophthora species; Pt, Paramecium tetraurelia; Sc, Saccharomyces cerevisiae; Tb, Trypanosoma brucei; Tp, Thalassiosira pseudonana; Tspp., Theileria species; Tt Tetrahymena thermophila; Tv, Trichomonas vaginalis.

Figure 3 Domain architectures of human NBR1 and p62 compared to protist proteins with similar domain compositions. See text for a discussion of these proteins. Each protein is labeled with its species of origin (Hs, Homo sapiens; Dd, Dictyostelium discoideum; Mb, Monosiga brevis; Tp, Thalassiosira pseudonana; Ps, Phytophthora spp.; Ng, Naegleria gruberi) and a genome identifier. Domains are PB1 (yellow hexagons), ZZ (red rectangles) and UBA (blue diamonds), small boxes represent coiled-coil regions and ellipses mark LIR motifs. Numbers to the right are sequence lengths, and the diagram is approximately to scale.
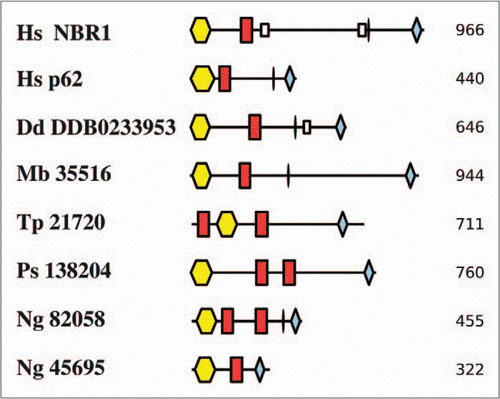
Figure 3 Domain architectures of human NBR1 and p62 compared to protist proteins with similar domain compositions. See text for a discussion of these proteins. Each protein is labeled with its species of origin (Hs, Homo sapiens; Dd, Dictyostelium discoideum; Mb, Monosiga brevis; Tp, Thalassiosira pseudonana; Ps, Phytophthora spp.; Ng, Naegleria gruberi) and a genome identifier. Domains are PB1 (yellow hexagons), ZZ (red rectangles) and UBA (blue diamonds), small boxes represent coiled-coil regions and ellipses mark LIR motifs. Numbers to the right are sequence lengths, and the diagram is approximately to scale.

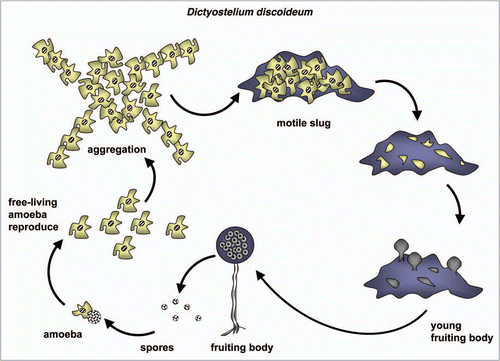
Figure 4 Diagram of the life cycle of Dictyostelium discoideum. For a detailed discussion of the life cycles of this and each of the organisms in and , see the text.

Figure 4 Diagram of the life cycle of Dictyostelium discoideum. For a detailed discussion of the life cycles of this and each of the organisms in Figures 6–8 and 10, see the text.

Figure 5 Dictyostelium autophagy mutants vary in the severity of their developmental phenotype. Amoebae were photographed following multicellular development on nitrocellulose filters. Wild-type (Wt) Dictyostelium elaborate fruiting bodies. Amoebae lacking ATG1 form loose mounds that rarely develop further. Amoebae lacking either ATG5 or ATG7 form multi-tipped aggregates, which form abnormal, small fruiting bodies at the end of thickened stalks; viable, detergentresistant spores are not produced. Mutants lacking either ATG6 or ATG8 form multi-tipped aggregates with small, but otherwise normal fruiting bodies; some viable, detergent-resistant spores are formed by these mutants. This research was originally published in the Journal of Biological Chemistry: parts Wt, atg5 and atg7 as , C and E, respectively, in Otto et al. Macroautophagy is required for multicellular development of the social amoeba Dictyostelium discoideum. J Biol Chem 2003; 278:17636–45 and parts atg1, atg6 and atg8 as , G and H, respectively, in Otto, et al. Dictyostelium macroautophagy mutants vary in the severity of their developmental defects. J Biol Chem 2004; 279:15621–9. ©The American Society for Biochemistry and Molecular Biology.
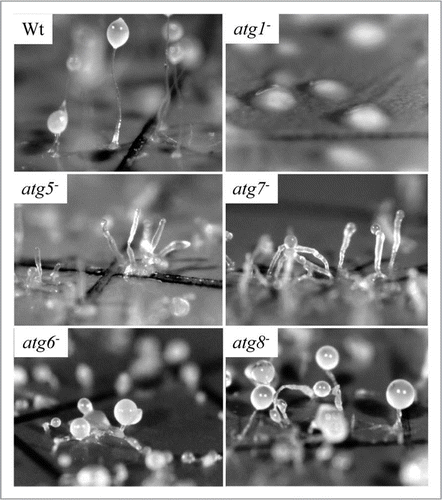
Figure 5 Dictyostelium autophagy mutants vary in the severity of their developmental phenotype. Amoebae were photographed following multicellular development on nitrocellulose filters. Wild-type (Wt) Dictyostelium elaborate fruiting bodies. Amoebae lacking ATG1 form loose mounds that rarely develop further. Amoebae lacking either ATG5 or ATG7 form multi-tipped aggregates, which form abnormal, small fruiting bodies at the end of thickened stalks; viable, detergentresistant spores are not produced. Mutants lacking either ATG6 or ATG8 form multi-tipped aggregates with small, but otherwise normal fruiting bodies; some viable, detergent-resistant spores are formed by these mutants. This research was originally published in the Journal of Biological Chemistry: parts Wt, atg5− and atg7− as Figure 3A, C and E, respectively, in Otto et al. Macroautophagy is required for multicellular development of the social amoeba Dictyostelium discoideum. J Biol Chem 2003; 278:17636–45 and parts atg1−, atg6− and atg8− as Figure 3B, G and H, respectively, in Otto, et al. Dictyostelium macroautophagy mutants vary in the severity of their developmental defects. J Biol Chem 2004; 279:15621–9. ©The American Society for Biochemistry and Molecular Biology.

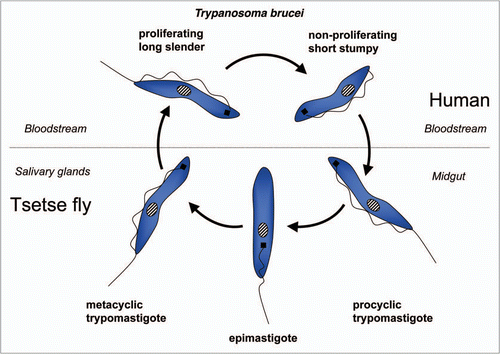
Figure 6 Diagram of the life cycle of Trypanosoma brucei.

Figure 6 Diagram of the life cycle of Trypanosoma brucei.

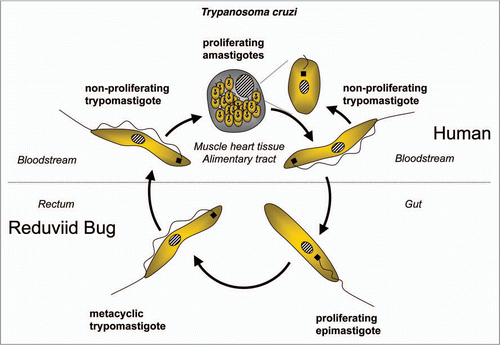
Figure 7 Diagram of the life cycle of Trypanosoma cruzi.

Figure 7 Diagram of the life cycle of Trypanosoma cruzi.

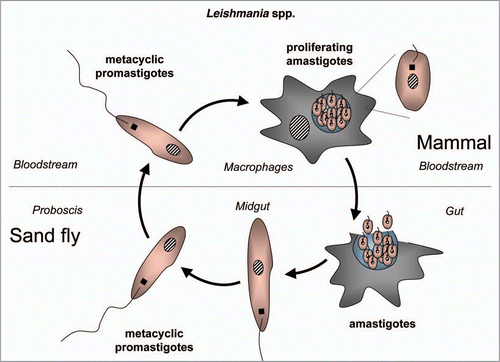
Figure 8 Diagram of the life cycle of Leishmania spp.

Figure 8 Diagram of the life cycle of Leishmania spp.

Figure 9 Transmission electron microscopy analysis of Trypanosoma cruzi epimastigotes treated with naphthoimidazole. (A, B, D and E) The parasites showed well-developed endoplasmic reticulum profiles (black arrows) surrounding organelles, especially reservosomes (R), suggesting a close contact between both membranes (black arrowheads), and commonly loss of the integrity of these organelle structures (white arrowheads). (C) A cytoplasmic vesicle near to a reservosome was also observed, suggesting fusion with the organelle (white arrows). Scale bars = 0.5 µm.
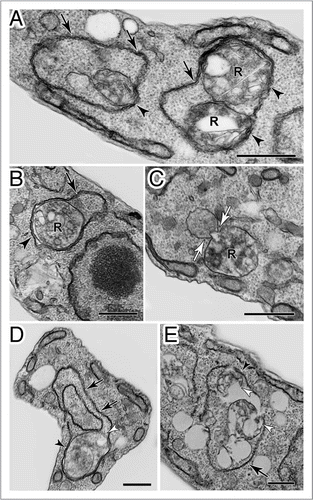
Figure 9 Transmission electron microscopy analysis of Trypanosoma cruzi epimastigotes treated with naphthoimidazole. (A, B, D and E) The parasites showed well-developed endoplasmic reticulum profiles (black arrows) surrounding organelles, especially reservosomes (R), suggesting a close contact between both membranes (black arrowheads), and commonly loss of the integrity of these organelle structures (white arrowheads). (C) A cytoplasmic vesicle near to a reservosome was also observed, suggesting fusion with the organelle (white arrows). Scale bars = 0.5 µm.

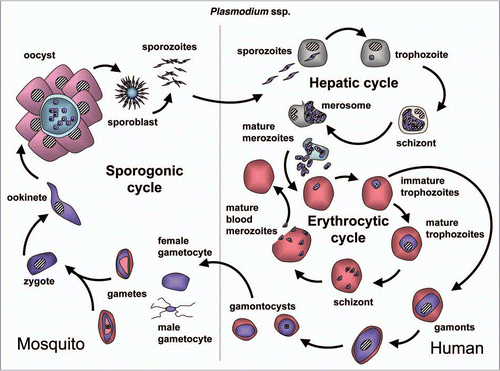
Figure 10 Diagram of the life cycle of Plasmodium spp.

Figure 10 Diagram of the life cycle of Plasmodium spp.

Figure 11 Presence of an autophagosomal structure in converting Plasmodium sporozoites. Electron microscopy of P. berghei sporozoites maintained in axenic condition for 3 h. The cytoplasm contains a double-membrane structure (arrow) sequestering micronemes (mi). Scale bar = 300 nm.
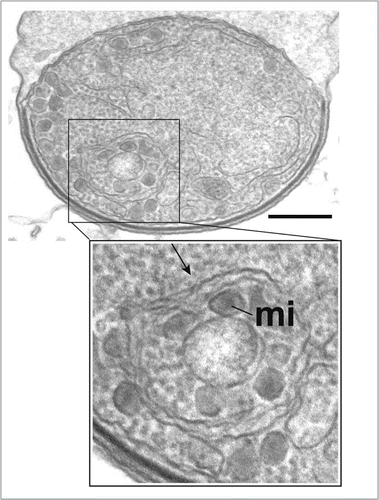
Figure 11 Presence of an autophagosomal structure in converting Plasmodium sporozoites. Electron microscopy of P. berghei sporozoites maintained in axenic condition for 3 h. The cytoplasm contains a double-membrane structure (arrow) sequestering micronemes (mi). Scale bar = 300 nm.

Table 1 Autophagic events in T. cruzi treated with naphthoimidazoles
Reprints and Corporate Permissions

Please note: Selecting permissions does not provide access to the full text of the article, please see our help page How do I view content?

To request a reprint or corporate permissions for this article, please click on the relevant link below:

Academic Permissions

Please note: Selecting permissions does not provide access to the full text of the article, please see our help page How do I view content?

Obtain permissions instantly via Rightslink by clicking on the button below:

If you are unable to obtain permissions via Rightslink, please complete and submit this Permissions form. For more information, please visit our Permissions help page.