809
Views
16
CrossRef citations to date
0
Altmetric
Report

Optimal epitope composition after antigen screening using a live bacterial delivery vector

Application to TRP-2

, , , , , , , & show all
Pages 51-60 | Received 24 Apr 2009, Accepted 09 Jul 2009, Published online: 01 Jan 2010

Figures & data

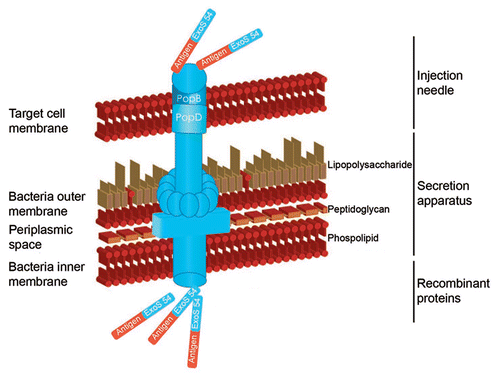
Figure 1 Schematic representation of the TTSS.

Figure 1 Schematic representation of the TTSS.

Figure 2 Type III-mediated injection into DCs in vivo. Mice were injected in the right flank with 5 × 10⁶ OST-CHA cells transformed with either pEAI-S54 plasmid without an antigen (control) or with the β-lactamase. Sixteen h after injection, DCs were isolated from the splenocytes and incubated with CCF2-AM. β-lactamase activity is revealed by the blue fluorescence emitted by the cleaved CCF2 product in DCs purified from β-lactamase-injected mouse (A) and control mouse (B). The uncleaved CCF2 emits in green fluorescence in DCs purified from β-lactamase-injected mouse (C) and control mouse (D). Live cells were observed by fluorescence microscopy. The scale bar is equivalent to 100 µm.
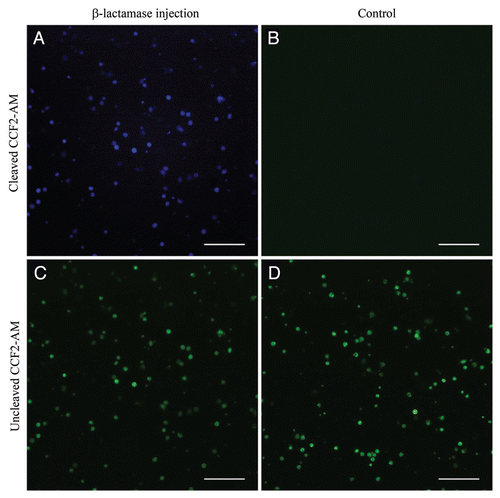
Figure 2 Type III-mediated injection into DCs in vivo. Mice were injected in the right flank with 5 × 10⁶ OST-CHA cells transformed with either pEAI-S54 plasmid without an antigen (control) or with the β-lactamase. Sixteen h after injection, DCs were isolated from the splenocytes and incubated with CCF2-AM. β-lactamase activity is revealed by the blue fluorescence emitted by the cleaved CCF2 product in DCs purified from β-lactamase-injected mouse (A) and control mouse (B). The uncleaved CCF2 emits in green fluorescence in DCs purified from β-lactamase-injected mouse (C) and control mouse (D). Live cells were observed by fluorescence microscopy. The scale bar is equivalent to 100 µm.

Figure 3 Screening for CTL epitopes. (A) A schematic diagram of the experimental design is shown. In parallel, 5 different antigens including TRP2, MUC18, survivin, gp100 and hgp100 were evaluated for different CTL epitopes in 42 days. (B) TTSS-mediated protein secretion was evaluated by SDS-PAGE (E and F). The positions of popB (bottom arrow) and popD (top arrow) are marked with arrows on the right. The positions of the EXO-S fusion proteins are marked with stars within the gel.
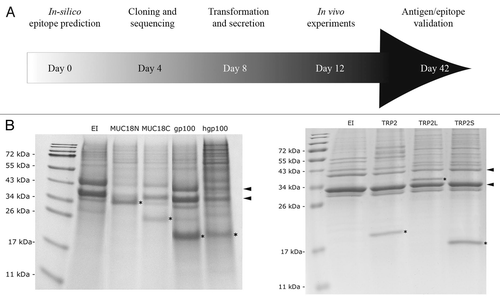
Figure 3 Screening for CTL epitopes. (A) A schematic diagram of the experimental design is shown. In parallel, 5 different antigens including TRP2, MUC18, survivin, gp100 and hgp100 were evaluated for different CTL epitopes in 42 days. (B) TTSS-mediated protein secretion was evaluated by SDS-PAGE (E and F). The positions of popB (bottom arrow) and popD (top arrow) are marked with arrows on the right. The positions of the EXO-S fusion proteins are marked with stars within the gel.

Figure 4 Survival of C57BL/6 mice with subcutaneously implanted GL26 tumor cells. Within 2-week mice received in the right flank 2 injections of CHA-OST expressing a target antigen. EI was the negative control CHA-OST strain transformed with pEAI-S54 plasmid without an antigen. Tumor cells were implanted 7 days after the last immunization. Kaplan-Meier curves displayed survival data from groups of 12 mice. Cumulative results of two independent experiments conducted with the same methodology are shown. Statistical analysis: TRP2L versus EI (p < 0.0001), TRP2L versus TRP2 (p = 0.002), and TRP2L versus TRP2S (p = 0.018). The vaccinations were performed with CHA-OST expressing (A) gp100, hgp100 and survivin, (B) TRP2, TRP2L and TRP2S, (C) MUC18N and MUC18C.
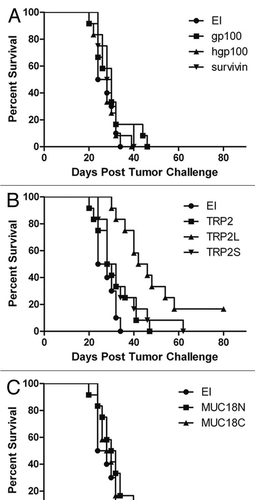
Figure 4 Survival of C57BL/6 mice with subcutaneously implanted GL26 tumor cells. Within 2-week mice received in the right flank 2 injections of CHA-OST expressing a target antigen. EI was the negative control CHA-OST strain transformed with pEAI-S54 plasmid without an antigen. Tumor cells were implanted 7 days after the last immunization. Kaplan-Meier curves displayed survival data from groups of 12 mice. Cumulative results of two independent experiments conducted with the same methodology are shown. Statistical analysis: TRP2L versus EI (p < 0.0001), TRP2L versus TRP2 (p = 0.002), and TRP2L versus TRP2S (p = 0.018). The vaccinations were performed with CHA-OST expressing (A) gp100, hgp100 and survivin, (B) TRP2, TRP2L and TRP2S, (C) MUC18N and MUC18C.

Figure 5 Characterization of the immune response induced by different TRP-2 constructs. (A) Schematic representation of TRP-2FL with different predicted and experimentally determined epitopes binding to H2-Kb (grey) and H2-Kd (black) MHC class I molecules. The TRP2125–243, TRP2S291–376 and TRP2L125–376 segments of the full-length proteins are represented below TRP-2FL. (B) TCR V-J combinatorial diversity analysis. TCR repertoire of draining lymph nodes (DLN) from naïve mice (n = 7) or from mice after two vaccinations with CHA-OST control cells (n = 8) or from mice injected with CHA-OST expressing OVA (n = 3), TRP2 (n = 6), TRP2L (n = 7), or TRP2S (n = 8) are shown. −+ A diversity of 100% corresponded to all theoretical TRB V-J recombinations considering all functional TRB V and BJ genes. (C) Induction of tumor-specific CTL in mice vaccinated against different TRP-2 constructions. Splenocytes from naïve or vaccinated mice were harvested 7 days after the last vaccination and restimulated for 6 days on mitomycin C-treated GL26 cells. LDH release was measured after 4 h of incubation at 37°C at different E:T ratios. Data represented the cytotoxicity of pooled splenic T lymphocytes from three mice.
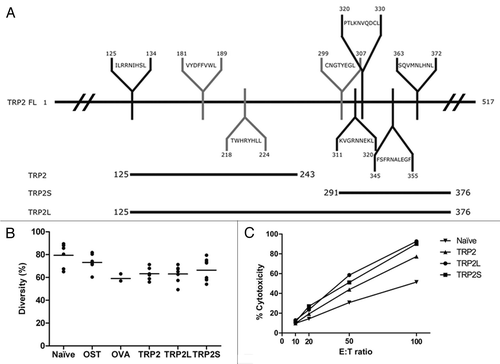
Figure 5 Characterization of the immune response induced by different TRP-2 constructs. (A) Schematic representation of TRP-2FL with different predicted and experimentally determined epitopes binding to H2-Kb (grey) and H2-Kd (black) MHC class I molecules. The TRP2125–243, TRP2S291–376 and TRP2L125–376 segments of the full-length proteins are represented below TRP-2FL. (B) TCR V-J combinatorial diversity analysis. TCR repertoire of draining lymph nodes (DLN) from naïve mice (n = 7) or from mice after two vaccinations with CHA-OST control cells (n = 8) or from mice injected with CHA-OST expressing OVA (n = 3), TRP2 (n = 6), TRP2L (n = 7), or TRP2S (n = 8) are shown. −+ A diversity of 100% corresponded to all theoretical TRB V-J recombinations considering all functional TRB V and BJ genes. (C) Induction of tumor-specific CTL in mice vaccinated against different TRP-2 constructions. Splenocytes from naïve or vaccinated mice were harvested 7 days after the last vaccination and restimulated for 6 days on mitomycin C-treated GL26 cells. LDH release was measured after 4 h of incubation at 37°C at different E:T ratios. Data represented the cytotoxicity of pooled splenic T lymphocytes from three mice.

Figure 6 Combination of PADRE epitope with TRP2S produced better tumor immunity. (A) Mice received 2 injections in the right flank at a 1-week interval with CHA-OST cells expressing either TRP2S or PADRE-TRP2S. Tumor cells were implanted 7 days after the last immunization. Kaplan-Meier curves displayed survival data from groups of 10 mice (cumulative results of two independent experiments conducted with the same methodology). Statistical analysis: PADRE-TRP2S versus PBS control p = 0.003. (B) Induction of tumor-specific CTL in mice vaccinated against TRP2S and PADRE-TRP2S. Splenocytes from naïve or vaccinated mice were harvested 7 days after the last vaccination and restimulated for 6 days on mitomycin C-treated GL26 cells. LDH release was measured after 4 h of incubation at 37°C with different E:T ratios. Data represented the mean value +/− SD from three animals per group.

Figure 6 Combination of PADRE epitope with TRP2S produced better tumor immunity. (A) Mice received 2 injections in the right flank at a 1-week interval with CHA-OST cells expressing either TRP2S or PADRE-TRP2S. Tumor cells were implanted 7 days after the last immunization. Kaplan-Meier curves displayed survival data from groups of 10 mice (cumulative results of two independent experiments conducted with the same methodology). Statistical analysis: PADRE-TRP2S versus PBS control p = 0.003. (B) Induction of tumor-specific CTL in mice vaccinated against TRP2S and PADRE-TRP2S. Splenocytes from naïve or vaccinated mice were harvested 7 days after the last vaccination and restimulated for 6 days on mitomycin C-treated GL26 cells. LDH release was measured after 4 h of incubation at 37°C with different E:T ratios. Data represented the mean value +/− SD from three animals per group.

Table 2 Antigens and epitopes evaluated