Figures & data
Figure 1 (A) Lysis tunnel formation and expulsion of the cytoplasmic contents—reproduced from Ebensen et al.Citation32 (B) Lysis tunnel formation, accompanied by the fusion of IM and OM (arrow)—reproduced from Witte et al.Citation16
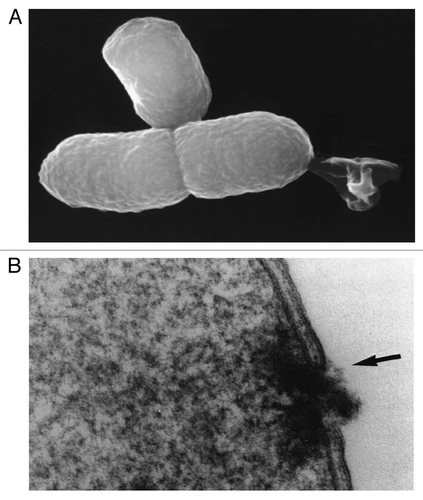
Figure 2 (A) Different methods for AG presentation in the BG envelope complex—BG themselves carry native AG (LPS, OMP, IMP, TCP, flagella, pili)—TA may be presented on the cell surface via fusion with OmpA—the PPS can be loaded with TA via MBP-SbsA-fusion proteins (1), by fusion of the TA with MBP (2) or as sole TA using the gene III signal sequence (3) Protein TA may be incorporated into the IM via E′, L′ or E′/L′-anchoring, biotinylated AG can be attached to E′-FXa-StrpA membrane anchors, DNA carrying the lac operator site can be attached to L′-anchored lacI repressor molecules—TA fused with SbsA-/SbsB proteins form S-layers in the PPS. (B) Model of lysis tunnel formation according to Schön et al.Citation23
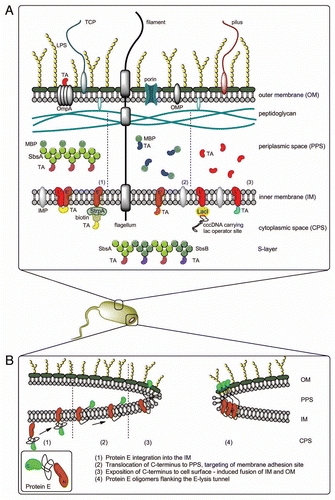
Figure 3 Fermentation protocol (growth/lysis phase) monitoring all relevant process parameters; (a) lysis induction, (b) lysis onset as indicated by dO2 up-shift, (c) stationary dO2 plateau indicating end of lysis phase.
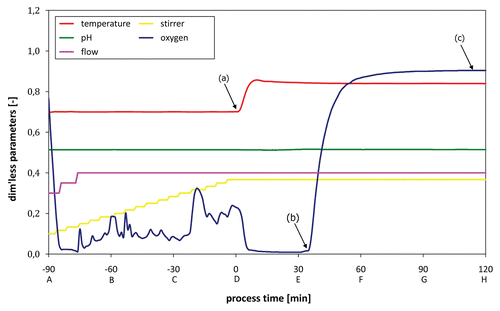
Figure 4 Process timeline for the production of BG including the pre-culture (ON) and downstream processing.
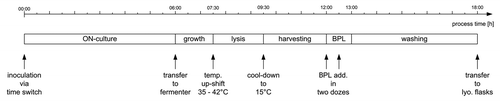
Figure 5 (a) Harvesting of the BG product via TFF; concentration from 20 to 2 l in the fermenter. (b) Washing of the BG product with 5.0 l dH2O via diafiltration; concentration from 2.0 l to 400 ml in a stirred reservoir.
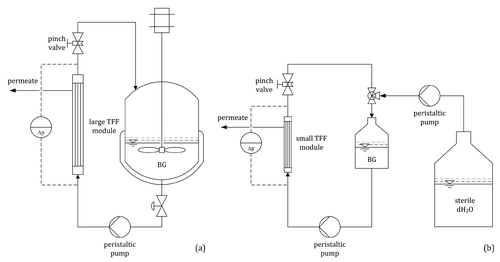
Figure 6 Flow cytometry pictures following the progress of lysis in an E. coli NM522 culture (pGLysivb); R1: living cells, R2: dead but intact cells, R3: lysed cells (BG); RN6: exclusion of non-cellular background with RH414 (not shown); FSC - forward scatter, FL1 - fluorescence intensity by DiBAC4(3); (a) sample D (0 minutes, lysis induction), (b) sample E (30 minutes), (c) sample H (120 minutes, end of lysis phase).
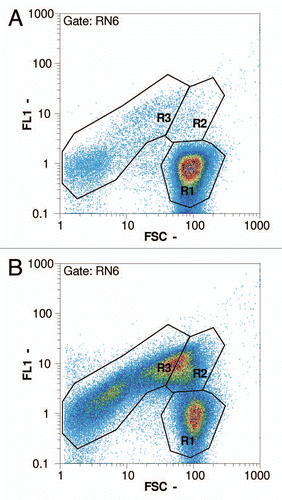
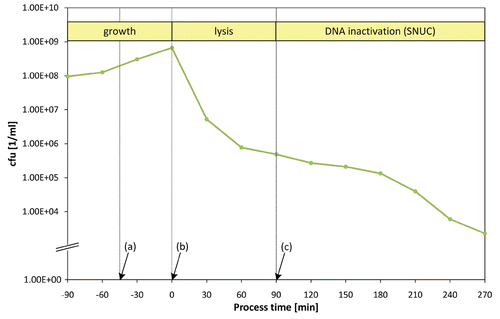
Figure 7 Standard fermentation for a S. flexneri 2a culture harboring plasmid pGLNic: (a) IPTG-addition at −45 min to induce biosynthesis of SNUC, (b) temperature up-shift to 42°C at 0 min to induce lysis, (c) pH up-shift to 8.0 and addition of Mg2+ and Ca2+ at +90 min to activate the enzymatic function of SNUC.