5,736
Views
75
CrossRef citations to date
0
Altmetric
Everything You Need To Know About...

Intravital microscopy

A practical guide on imaging intracellular structures in live animals

, , , , , & show all
Pages 143-157 | Received 28 Jul 2012, Accepted 07 Aug 2012, Published online: 01 Sep 2012

Figures & data

Table 1. Imaging techniques used for intravital microscopy

Figure 1. Imaging depth in intravital microscopy. (A) Jablonski diagram of fluorophore excitation by single and multiphoton microscopy. The energy gap between two energy levels (ground state, E0 and excited state, E*) can be filled by one, two or three photons. After thermal decay, the system relaxes to the ground state by emitting a photon. (B) All the photons generated by the imaging area are emitted, and collected by the detection system. (C) When the imaging area is located in solid tissue both the excitation beam (blue arrows) and the emitted photons (green arrows) are scattered. The deeper the targeted area the lower is the probability to excite a transition or to detect the emitted photons. (D) Diagram illustrating imaging modality, resolution and optics as a function of imaging depth. (E) Diagram illustrating alternative approaches to extend the imaging depth by MPM. (F) Diagram illustrating GRIN lenses and micro prisms inserted in the tissue to image up to 1–2 mm in depth. (G) Effect of the clearing agent scale/e. A portion of the quadriceps was excised from a mouse expressing soluble GFP, fixed in 2% formaldehyde and incubated for 3 d in the clearing agent scale/e.Citation40 A z-scan was acquired by two-photon microscopy (excitation wavelength 930 nm) using water immersion 25x lens (XLPL25XWMP, from Olympus). Notably, cleared tissue was imaged up to 1.2 mm and the muscle fibers were nicely resolved, whereas usually non-cleared tissue cannot be imaged beyond 500 µm.
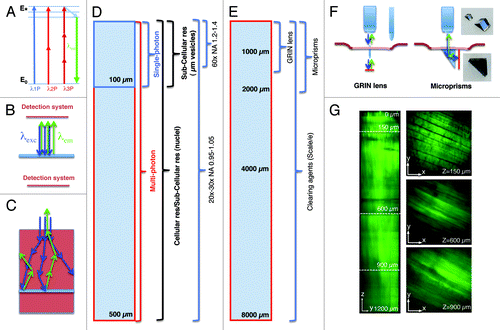
Figure 1. Imaging depth in intravital microscopy. (A) Jablonski diagram of fluorophore excitation by single and multiphoton microscopy. The energy gap between two energy levels (ground state, E0 and excited state, E*) can be filled by one, two or three photons. After thermal decay, the system relaxes to the ground state by emitting a photon. (B) All the photons generated by the imaging area are emitted, and collected by the detection system. (C) When the imaging area is located in solid tissue both the excitation beam (blue arrows) and the emitted photons (green arrows) are scattered. The deeper the targeted area the lower is the probability to excite a transition or to detect the emitted photons. (D) Diagram illustrating imaging modality, resolution and optics as a function of imaging depth. (E) Diagram illustrating alternative approaches to extend the imaging depth by MPM. (F) Diagram illustrating GRIN lenses and micro prisms inserted in the tissue to image up to 1–2 mm in depth. (G) Effect of the clearing agent scale/e. A portion of the quadriceps was excised from a mouse expressing soluble GFP, fixed in 2% formaldehyde and incubated for 3 d in the clearing agent scale/e.Citation40 A z-scan was acquired by two-photon microscopy (excitation wavelength 930 nm) using water immersion 25x lens (XLPL25XWMP, from Olympus). Notably, cleared tissue was imaged up to 1.2 mm and the muscle fibers were nicely resolved, whereas usually non-cleared tissue cannot be imaged beyond 500 µm.

Figure 2. Laser power and detector sensitivity in intravital two-photon microscopy. Anesthetized rats were injected with Hoechst (blue) and Texas red-dextran (red) (A), Texas red–dextran alone (B), Texas Red- and Alexa 488-Dextran (green) (C) or not injected. After 2 h, the salivary glands were exposed and imaged by two-photon microscopy (excitation 750 nm) using a 60x water immersion objective (NA 1.2, Olympus). (A) Salivary glands were imaged by using 3 different laser powers (7 mW, 14mW and 24 mW, as measured at the objective). Dextran was internalized by stromal cells (red) and Hoechst labeled the nuclei (blue). Bar, 50 µm. (B and C) Salivary glands were imaged using two laser powers: 30 mW (B) and 15 mW (C). (B) Excitation of endogenous fluorescence reveals the parenchyma (cyan) whereas stromal cells are highlighted by internalized dextran (red). After 1 min, the tissue shows signs of photodamage (arrows) and around 2 min is completely disrupted (Vid. S1) Bar, 40 µm. (C) Internalized dextrans are localized in two different endosomal populations within stromal cells and exhibit high mobility within the first 30 sec (see area within dotted circles). Endosomal mobility is suddenly stopped after 1–2 min from the beginning of the imaging session (Vid. S2) Note also that photobleaching occurred (right panel). Bar 10 µm. (D) Z-scan of unstained salivary glands by using a conventional multialkali detector (left panel) or GaAS detector (right panel).
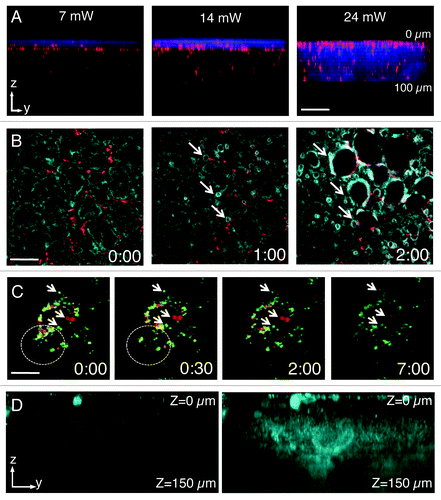
Figure 2. Laser power and detector sensitivity in intravital two-photon microscopy. Anesthetized rats were injected with Hoechst (blue) and Texas red-dextran (red) (A), Texas red–dextran alone (B), Texas Red- and Alexa 488-Dextran (green) (C) or not injected. After 2 h, the salivary glands were exposed and imaged by two-photon microscopy (excitation 750 nm) using a 60x water immersion objective (NA 1.2, Olympus). (A) Salivary glands were imaged by using 3 different laser powers (7 mW, 14mW and 24 mW, as measured at the objective). Dextran was internalized by stromal cells (red) and Hoechst labeled the nuclei (blue). Bar, 50 µm. (B and C) Salivary glands were imaged using two laser powers: 30 mW (B) and 15 mW (C). (B) Excitation of endogenous fluorescence reveals the parenchyma (cyan) whereas stromal cells are highlighted by internalized dextran (red). After 1 min, the tissue shows signs of photodamage (arrows) and around 2 min is completely disrupted (Vid. S1) Bar, 40 µm. (C) Internalized dextrans are localized in two different endosomal populations within stromal cells and exhibit high mobility within the first 30 sec (see area within dotted circles). Endosomal mobility is suddenly stopped after 1–2 min from the beginning of the imaging session (Vid. S2) Note also that photobleaching occurred (right panel). Bar 10 µm. (D) Z-scan of unstained salivary glands by using a conventional multialkali detector (left panel) or GaAS detector (right panel).

Figure 3. Comparison between two-photon and confocal microscopy at different magnifications. (A) The salivary glands of a transgenic mouse expressing Lifeact-GFP were imaged by confocal microscopy (excitation 488 nm) using an oil immersion lens (NA 1.4, Olympus). A z-scan was acquired reaching a maximum depth of 60 nm (zy view). In the xy views, myoepithelial cells (arrows) and the apical plasma membrane (arrowheads) are highlighted. (B) Human head and neck squamous carcinoma cells (HN12) were engineered to express GFP-histone 2B and injected in the back of an immunocompromised mouse. After 2 weeks, Texas red-dextran was injected systemically, the primary tumor was surgically exposed and imaged by intravital two-photon microscopy (excitation 930 nm) with a 60x water immersion lens (NA 1.2, Olympus). A z-scan shows that two-photon microscopy extend the imaging depth to 120 µm (see xy views). The surface of the tumor was determined by visualizing collagen fibers that are excited at this wavelength (cyan) and superficial stromal cells (red) that internalize dextran. The tumor mass is highlighted by the nuclear staining (green). (C) A mouse ubiquitously expressing a membrane targeted peptide fused to the tandem tomato (m-tomato) was engineered to express a membrane targeted peptide fused to GFP (m-GFP) in keratin 14-expressing cells as previously described.Citation83 The liver was excised and imaged by either confocal (left panels, excitation 488nm and 561 nm) or two-photon (excitation 930 nm) microscopy with a 25x water lens (NA 1.05, Olympus). GFP expressing cells are confined to the surface of the liver (cyan) whereas the hepatocytes were imaged up to 90 µm (confocal) or 250 µm (two-photon). (D) The mouse described in (C) was injected with Hoechst, and the tongue was imaged by either confocal (excitation 350 nm and 488 nm) or two-photon (excitation 820 nm) using a 30x silicon lens (NA 1.05, Olympus). A z-scan shows that nuclei (blue) can be imaged up to 100 µm (confocal) or 300 µm (two-photon).
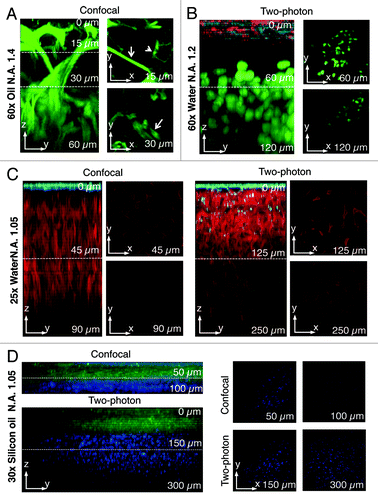
Figure 3. Comparison between two-photon and confocal microscopy at different magnifications. (A) The salivary glands of a transgenic mouse expressing Lifeact-GFP were imaged by confocal microscopy (excitation 488 nm) using an oil immersion lens (NA 1.4, Olympus). A z-scan was acquired reaching a maximum depth of 60 nm (zy view). In the xy views, myoepithelial cells (arrows) and the apical plasma membrane (arrowheads) are highlighted. (B) Human head and neck squamous carcinoma cells (HN12) were engineered to express GFP-histone 2B and injected in the back of an immunocompromised mouse. After 2 weeks, Texas red-dextran was injected systemically, the primary tumor was surgically exposed and imaged by intravital two-photon microscopy (excitation 930 nm) with a 60x water immersion lens (NA 1.2, Olympus). A z-scan shows that two-photon microscopy extend the imaging depth to 120 µm (see xy views). The surface of the tumor was determined by visualizing collagen fibers that are excited at this wavelength (cyan) and superficial stromal cells (red) that internalize dextran. The tumor mass is highlighted by the nuclear staining (green). (C) A mouse ubiquitously expressing a membrane targeted peptide fused to the tandem tomato (m-tomato) was engineered to express a membrane targeted peptide fused to GFP (m-GFP) in keratin 14-expressing cells as previously described.Citation83 The liver was excised and imaged by either confocal (left panels, excitation 488nm and 561 nm) or two-photon (excitation 930 nm) microscopy with a 25x water lens (NA 1.05, Olympus). GFP expressing cells are confined to the surface of the liver (cyan) whereas the hepatocytes were imaged up to 90 µm (confocal) or 250 µm (two-photon). (D) The mouse described in (C) was injected with Hoechst, and the tongue was imaged by either confocal (excitation 350 nm and 488 nm) or two-photon (excitation 820 nm) using a 30x silicon lens (NA 1.05, Olympus). A z-scan shows that nuclei (blue) can be imaged up to 100 µm (confocal) or 300 µm (two-photon).

Figure 4. Minimization of motion artifacts. (A) Custom-made holders were built to accommodate mice and rat salivary glands (left panels), rat kidney (center right panel) or mouse tongue (right panel). (B–E) Anesthetized rats were either injected with Hoechst (B, C and E) or the salivary glands were exposed and bathed with Texas Red-dextran to label the stroma (D). Time-lapse imaging was performed by two-photon microscopy (excitation 800 nm for B, C and E; 930 nm for D). Salivary glands were exposed and imaged directly with a 60x water immersion objective (NA 1.2, Olympus) (B), or exposed and placed in a custom made holder without (C) or with a coverglass to minimize the motion (D and E). In (B), motion artifacts create distortions within the frames (arrows), shifts in the xy plane and changes in the focal plane. In (C), although several structures are still in register (arrowheads) distortions within the frames are observed (arrows). In (D), only shifts in the xy plane are observed and can be corrected by using software such as ImageJ (Stack-ref plug ins) (E). Bars, 20 µm.
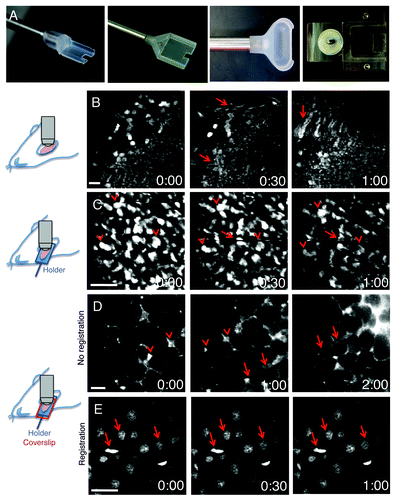
Figure 4. Minimization of motion artifacts. (A) Custom-made holders were built to accommodate mice and rat salivary glands (left panels), rat kidney (center right panel) or mouse tongue (right panel). (B–E) Anesthetized rats were either injected with Hoechst (B, C and E) or the salivary glands were exposed and bathed with Texas Red-dextran to label the stroma (D). Time-lapse imaging was performed by two-photon microscopy (excitation 800 nm for B, C and E; 930 nm for D). Salivary glands were exposed and imaged directly with a 60x water immersion objective (NA 1.2, Olympus) (B), or exposed and placed in a custom made holder without (C) or with a coverglass to minimize the motion (D and E). In (B), motion artifacts create distortions within the frames (arrows), shifts in the xy plane and changes in the focal plane. In (C), although several structures are still in register (arrowheads) distortions within the frames are observed (arrows). In (D), only shifts in the xy plane are observed and can be corrected by using software such as ImageJ (Stack-ref plug ins) (E). Bars, 20 µm.

Figure 5. The objective inverter. (A) Objective inverter from LSM tech to convert a microscope from an inverted into an upright configuration. (B) The inverter is equipped with a rotating hinge that allows tilting the objective in order to image inclined surfaces. (C) Objective inverter to convert a microscope from an upright into an inverted configuration. (D) Objective inverter with a multialkali detector installed on top of the lens to shorten the light path and increase the efficiency of light collection.
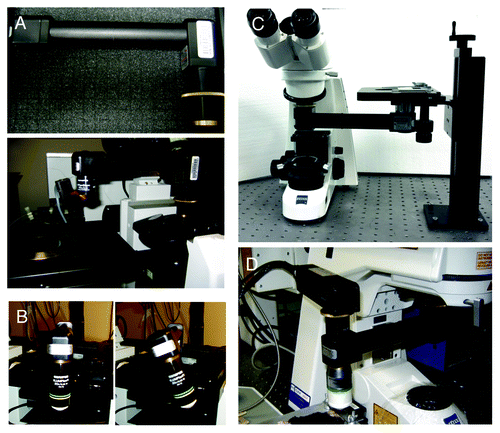
Figure 5. The objective inverter. (A) Objective inverter from LSM tech to convert a microscope from an inverted into an upright configuration. (B) The inverter is equipped with a rotating hinge that allows tilting the objective in order to image inclined surfaces. (C) Objective inverter to convert a microscope from an upright into an inverted configuration. (D) Objective inverter with a multialkali detector installed on top of the lens to shorten the light path and increase the efficiency of light collection.

Figure 6. Fluorescent probes administered systemically or topically on the exposed organ. (A) The salivary glands of an anesthetized rat were exposed, and 70 kDa Texas Red-dextran was injected systemically. The glands were imaged in time lapse by two-photon microscopy (excitation 800 nm) using a 60x water immersion lens (NA 1.2, Olympus) and Hoechst was injected. The dye rapidly diffused from the vasculature (red) and labeled the nuclei of the adjacent cells (green) (Vid. S3). (B–D) The salivary glands (B and C) and the mammary glands (D) of anesthetized rats were exposed and bathed in mitotracker (B), FM-64 (C) and bodipy 665 (D) to label for mitochondria, plasma membrane and lipid droplets, respectively. The organs were exposed and imaged by confocal microscopy (excitation 561 nm) using a 60x water immersion lens (NA 1.2, Olympus). Bars, 10 µm. (E) The liver of an anesthetized rat was exposed, bathed with Rhodamine 123 and imaged by two-photon microscopy (excitation 750 nm) using a 60x water immersion lens (NA 1.2, Olympus) (Vid. S4). Bar, 5 µm.
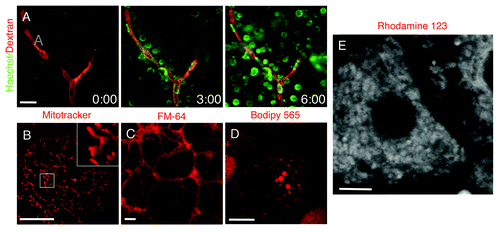
Figure 6. Fluorescent probes administered systemically or topically on the exposed organ. (A) The salivary glands of an anesthetized rat were exposed, and 70 kDa Texas Red-dextran was injected systemically. The glands were imaged in time lapse by two-photon microscopy (excitation 800 nm) using a 60x water immersion lens (NA 1.2, Olympus) and Hoechst was injected. The dye rapidly diffused from the vasculature (red) and labeled the nuclei of the adjacent cells (green) (Vid. S3). (B–D) The salivary glands (B and C) and the mammary glands (D) of anesthetized rats were exposed and bathed in mitotracker (B), FM-64 (C) and bodipy 665 (D) to label for mitochondria, plasma membrane and lipid droplets, respectively. The organs were exposed and imaged by confocal microscopy (excitation 561 nm) using a 60x water immersion lens (NA 1.2, Olympus). Bars, 10 µm. (E) The liver of an anesthetized rat was exposed, bathed with Rhodamine 123 and imaged by two-photon microscopy (excitation 750 nm) using a 60x water immersion lens (NA 1.2, Olympus) (Vid. S4). Bar, 5 µm.

Figure 7. Transfections of naked DNA in live animals. (A–I) Rats were anesthetized, two fine polyethylene tubing inserted in the salivary duct and naked DNA injected as previously described.Citation18,Citation75 Specifically, DNAs encoding the following probes were injected: β-adrenergic receptor-GFP (A) and Aquaporin 5-GFP (B), markers for the basolateral (arrows) and apical (arrowheads) plasma membrane respectively; mCherry-TGN38 (C) a marker for the trans-Golgi network; GFP-transferrin receptor, a marker for early and recycling endosomes (D); GFP-myosin Vc, a marker for constitutive secretory vesicles (E); GFP-actin (F); GFP-lifeact (G and H). The glands were exposed, and imaged by two-photon microscopy (A–F, excitation 930 nm) or bathed with Texas Red-dextran to highlight the acinar structures.Citation18 The animals were injected with either saline (G and I) or isoproterenol (H) to stimulate exocytosis, and imaged as described above. GFP-lifeact is expressed in acinar cells (G and H) and localized at the apical plasma membrane (G, arrow). Upon stimulation with isoproterenol, GFP lifeact is recruited onto secretory granules (H, arrowheads). In (I), GFP lifeact is expressed in myoepithelial cells. (J) Human squamous carcinoma cells (Hela-O3) were engineered to express GFP-lifeact and injected in the tongue of immunocompromised mice. After 5 d the mouse was injected with Hoechst (red) and imaged by two-photon microscopy (excitation 930 nm) using a 25x water immersion lens (NA 1.05, Olympus). F-actin is enriched in the protrusions at the cell surface of the tumor cells (Vid. S5). Bars, 20 µm.
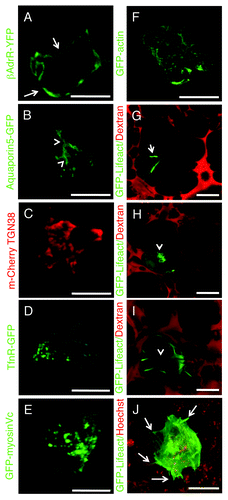
Figure 7. Transfections of naked DNA in live animals. (A–I) Rats were anesthetized, two fine polyethylene tubing inserted in the salivary duct and naked DNA injected as previously described.Citation18,Citation75 Specifically, DNAs encoding the following probes were injected: β-adrenergic receptor-GFP (A) and Aquaporin 5-GFP (B), markers for the basolateral (arrows) and apical (arrowheads) plasma membrane respectively; mCherry-TGN38 (C) a marker for the trans-Golgi network; GFP-transferrin receptor, a marker for early and recycling endosomes (D); GFP-myosin Vc, a marker for constitutive secretory vesicles (E); GFP-actin (F); GFP-lifeact (G and H). The glands were exposed, and imaged by two-photon microscopy (A–F, excitation 930 nm) or bathed with Texas Red-dextran to highlight the acinar structures.Citation18 The animals were injected with either saline (G and I) or isoproterenol (H) to stimulate exocytosis, and imaged as described above. GFP-lifeact is expressed in acinar cells (G and H) and localized at the apical plasma membrane (G, arrow). Upon stimulation with isoproterenol, GFP lifeact is recruited onto secretory granules (H, arrowheads). In (I), GFP lifeact is expressed in myoepithelial cells. (J) Human squamous carcinoma cells (Hela-O3) were engineered to express GFP-lifeact and injected in the tongue of immunocompromised mice. After 5 d the mouse was injected with Hoechst (red) and imaged by two-photon microscopy (excitation 930 nm) using a 25x water immersion lens (NA 1.05, Olympus). F-actin is enriched in the protrusions at the cell surface of the tumor cells (Vid. S5). Bars, 20 µm.

Figure 8. Transgenic mice models currently used for intravital microscopy. (A–O) Selected transgenic mice were anesthetized, the organs indicated in the panels exposed, and imaged by confocal microscopy (excitation 488 nm, A and C–M; excitation 561, B; excitation 488 and 561, N and O) at a depth of approximately 30 µm by using a 60x oil immersion lens (NA 1.4, Olympus). (A) GFP-FVB mouse expressing soluble GFP. Nuclei (arrows) and secretory granules (inset) are highlighted in the pancreas. (B–E) Mice expressing a membrane targeted peptide fused with tandem Tomato (B) or GFP (C–E) (Vids. S6 and S7). In the salivary glands the mTomato probe is localized at the plasma membrane (B, arrows), in the kidney the mGFP probe highlights the microvasculature (C, arrows), both proximal and distal tubuli (B, arrowheads), and a series of small endocytic vesicles (D, arrows; Vid. S6); in the small intestine, mGFP is localized at the plasma membrane of the enterocytes (F, arrows; Vid. S7). (F) Mouse expressing GFP fused to a myristoylated peptide (GFP-myr). In exocrine pancreas, GFP-myr is localized onto the secretory granules (arrows). (G) Mouse expressing GFP-GLUT4 in the skeletal muscle. GFP-Glut4 is localized in small vesicles (G, arrows; Vid. S8). (H–J) In the salivary glands, GFP-lifeact is expressed in both myoepithelial (H and J, arrows) and at the apical pole of acinar cells (H and J, arrowheads; Vid. S9). (K–M) GFP-myosin IIb is expressed in the kidney in several intracellular structures (K, arrows), in liver hepatocytes, both at the plasma membrane and small vesicles (H, arrows), and in the spleen in long filaments (M). (N and O) Mice expressing GFP-myosin IIb and RFP-lifeact. In salivary glands both GFP and myosin IIb are localized at the plasma membrane (N), whereas in neutrophils in mammary glands, GFP-myosin IIb is localized in protrusive edges (O; Vid. S10). Bars, 20 µm.
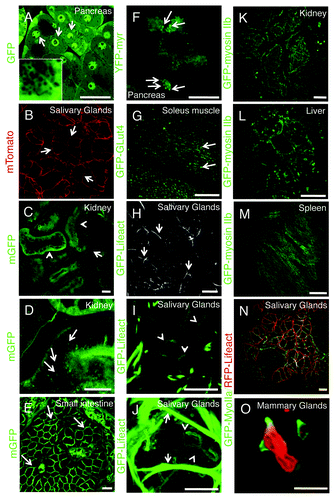
Figure 8. Transgenic mice models currently used for intravital microscopy. (A–O) Selected transgenic mice were anesthetized, the organs indicated in the panels exposed, and imaged by confocal microscopy (excitation 488 nm, A and C–M; excitation 561, B; excitation 488 and 561, N and O) at a depth of approximately 30 µm by using a 60x oil immersion lens (NA 1.4, Olympus). (A) GFP-FVB mouse expressing soluble GFP. Nuclei (arrows) and secretory granules (inset) are highlighted in the pancreas. (B–E) Mice expressing a membrane targeted peptide fused with tandem Tomato (B) or GFP (C–E) (Vids. S6 and S7). In the salivary glands the mTomato probe is localized at the plasma membrane (B, arrows), in the kidney the mGFP probe highlights the microvasculature (C, arrows), both proximal and distal tubuli (B, arrowheads), and a series of small endocytic vesicles (D, arrows; Vid. S6); in the small intestine, mGFP is localized at the plasma membrane of the enterocytes (F, arrows; Vid. S7). (F) Mouse expressing GFP fused to a myristoylated peptide (GFP-myr). In exocrine pancreas, GFP-myr is localized onto the secretory granules (arrows). (G) Mouse expressing GFP-GLUT4 in the skeletal muscle. GFP-Glut4 is localized in small vesicles (G, arrows; Vid. S8). (H–J) In the salivary glands, GFP-lifeact is expressed in both myoepithelial (H and J, arrows) and at the apical pole of acinar cells (H and J, arrowheads; Vid. S9). (K–M) GFP-myosin IIb is expressed in the kidney in several intracellular structures (K, arrows), in liver hepatocytes, both at the plasma membrane and small vesicles (H, arrows), and in the spleen in long filaments (M). (N and O) Mice expressing GFP-myosin IIb and RFP-lifeact. In salivary glands both GFP and myosin IIb are localized at the plasma membrane (N), whereas in neutrophils in mammary glands, GFP-myosin IIb is localized in protrusive edges (O; Vid. S10). Bars, 20 µm.
Supplemental material

Additional material

Download Zip (53.6 MB)