Figures & data
Figure 1. Diagram showing the steps of an ABM simulation.
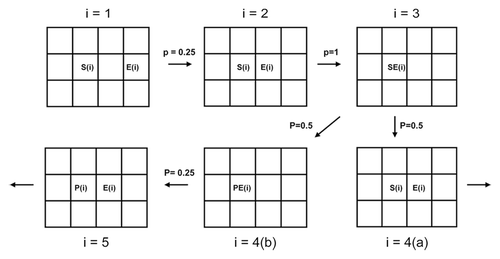
Figure 2. Number of iterations required for cellulose hydrolysis and sugar consumption for 200 independent simulations given bacteria cell density values ranging between 10 and 100 cells per simulation. Large variance was calculated at low cell densities.
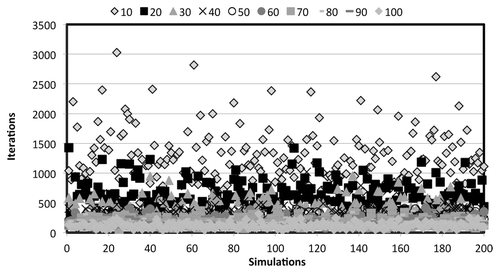
Figure 3. Variance of cellulose hydrolysis and sugar consumption over 200 iterations as a function of the bacteria cell density (number of cells) for the three different cellulase enzyme expression systems.
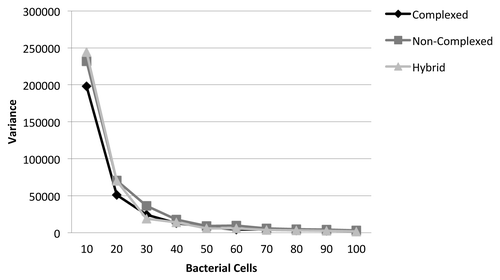
Table 2. The t test results comparing cellulase expression systems
Figure 4. Iterations required for changing ratios of exoglucanase and endoglucanase at constant β-glucosidase.
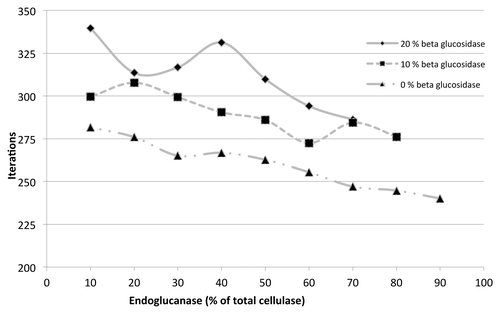
Figure 5. First-order indices of the GSA for parameters listed in .
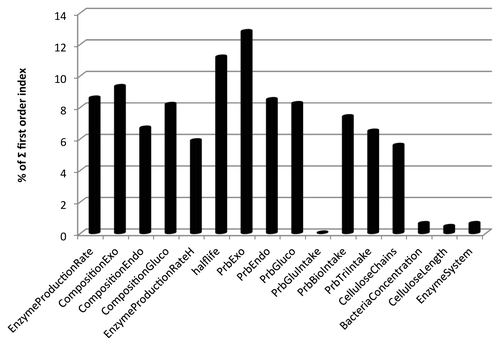
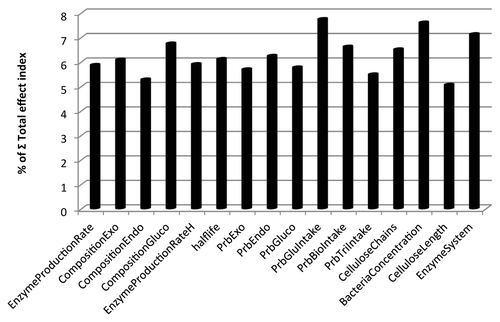
Figure 6. Total effect indices of the GSA for parameters listed in .