789
Views
3
CrossRef citations to date
0
Altmetric
Research Paper

Antigen profiling analysis of vaccinia virus injected canine tumors

Oncolytic virus efficiency predicted by boolean models

, , , , &
Pages 319-325 | Received 13 May 2014, Accepted 31 Jul 2014, Published online: 31 Jul 2014

Figures & data

Figure 1. This figure depicts the general layout of the signaling model used to calculate the oncolytic virus effects on different types of canine cancers. In this model the apoptosis, MAPK, p53, WNT, Hedgehog, TK cell mediated cell death, IFN, and Interleukin signaling, as well as mitochondrial Ca2+- signaling are included. Yellow boxes denote the possible input signals for the models; green boxes denote genes with anti-apoptotic properties. The outcome of the model is given in the signaling strength of the purple (survival of cancer cell) and orange (apoptosis of cancer cell) boxes.
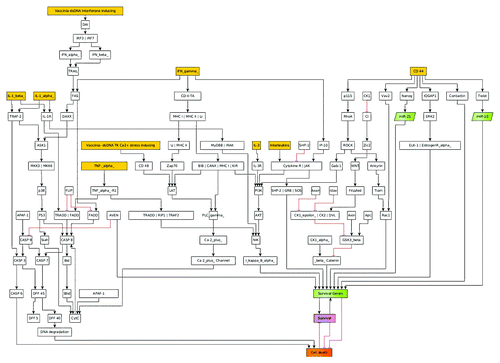
Figure 1. This figure depicts the general layout of the signaling model used to calculate the oncolytic virus effects on different types of canine cancers. In this model the apoptosis, MAPK, p53, WNT, Hedgehog, TK cell mediated cell death, IFN, and Interleukin signaling, as well as mitochondrial Ca2+- signaling are included. Yellow boxes denote the possible input signals for the models; green boxes denote genes with anti-apoptotic properties. The outcome of the model is given in the signaling strength of the purple (survival of cancer cell) and orange (apoptosis of cancer cell) boxes.

Figure 2. Shown here are models and/or ratios of tumor survival and apoptosis of the canine, MTH52c, STSA-1, and ZMTH3 tumors in nude mice. In order to estimate the differences between tumor survival and apoptosis, the polynomial area of the diagrams were calculated. Without viral therapy the tumors are in indefinite proliferation.
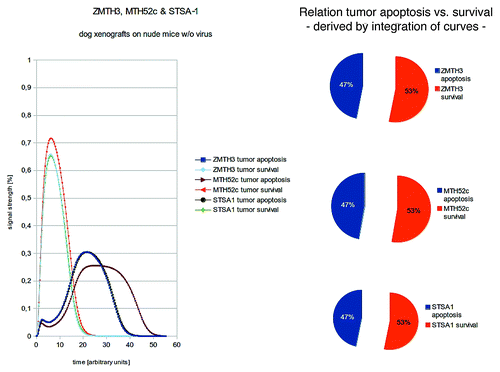
Figure 2. Shown here are models and/or ratios of tumor survival and apoptosis of the canine, MTH52c, STSA-1, and ZMTH3 tumors in nude mice. In order to estimate the differences between tumor survival and apoptosis, the polynomial area of the diagrams were calculated. Without viral therapy the tumors are in indefinite proliferation.

Figure 3. Models and/or ratios of tumor survival and apoptosis of the canine MTH52c, STSA-1, and ZMTH3 tumors in nude mice after therapy with different vaccinia virus strains. Again the polynomial areas of the diagrams were calculated. ZMTH3 and MTH52c both react very well to VACV- treatments and show tumor apoptosis that conform with in vivo findings. STSA-1 was treated with different virus strains (GLV-1h68, LIVP 1.1.1, and LIVP 5.1.1) and shows the highest tumor apoptosis when treated with LIVP 1.1.1- again in full agreement with the in vivo findings.
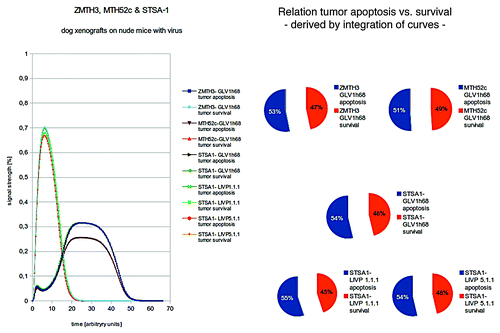
Figure 3. Models and/or ratios of tumor survival and apoptosis of the canine MTH52c, STSA-1, and ZMTH3 tumors in nude mice after therapy with different vaccinia virus strains. Again the polynomial areas of the diagrams were calculated. ZMTH3 and MTH52c both react very well to VACV- treatments and show tumor apoptosis that conform with in vivo findings. STSA-1 was treated with different virus strains (GLV-1h68, LIVP 1.1.1, and LIVP 5.1.1) and shows the highest tumor apoptosis when treated with LIVP 1.1.1- again in full agreement with the in vivo findings.

Figure 4. Growth of canine prostate carcinoma tumors in virus- and mock-treated mice. Groups of CT1258 tumor-bearing nude mice (n = 5) were either treated with a single dose of 5 × 10⁶ pfu GLV-1h68 or with PBS (mock control). Tumor size was measured twice a week. There were no significant differences between groups (P > 0.05).
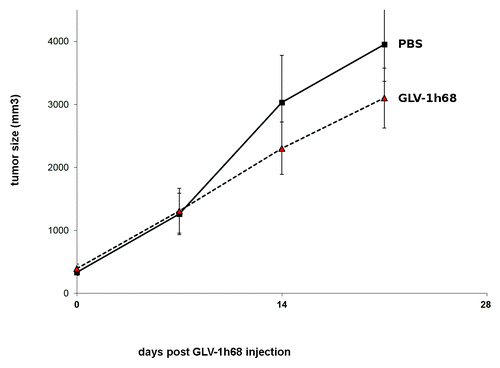
Figure 4. Growth of canine prostate carcinoma tumors in virus- and mock-treated mice. Groups of CT1258 tumor-bearing nude mice (n = 5) were either treated with a single dose of 5 × 10⁶ pfu GLV-1h68 or with PBS (mock control). Tumor size was measured twice a week. There were no significant differences between groups (P > 0.05).
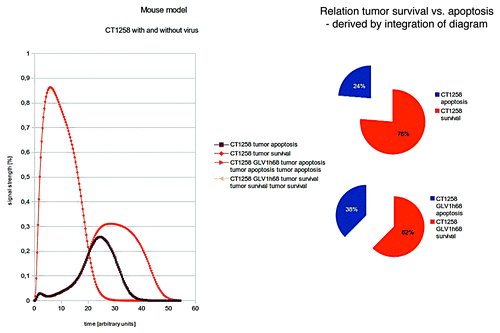
Figure 5. Two different treatments of CT1258 are compared: no therapy vs. VACV treatment. Again the polynomial areas of the diagrams were calculated. CT1258 is shown to be highly aggressive in vivo. Our in silico modeling shows a highly proliferating tumor in the case of no treatment.

Figure 5. Two different treatments of CT1258 are compared: no therapy vs. VACV treatment. Again the polynomial areas of the diagrams were calculated. CT1258 is shown to be highly aggressive in vivo. Our in silico modeling shows a highly proliferating tumor in the case of no treatment.
Supplemental material

Additional material

Download Zip (682.4 KB)

Reprints and Corporate Permissions

Please note: Selecting permissions does not provide access to the full text of the article, please see our help page How do I view content?

To request a reprint or corporate permissions for this article, please click on the relevant link below:

Academic Permissions

Please note: Selecting permissions does not provide access to the full text of the article, please see our help page How do I view content?

Obtain permissions instantly via Rightslink by clicking on the button below:

If you are unable to obtain permissions via Rightslink, please complete and submit this Permissions form. For more information, please visit our Permissions help page.