Figures & data
Figure 1. Interplay of inflammatory mediators involved in the process of monocyte to macrophage differentiation under condition of sterile tissue injury. Chemokines and cytokines released from activated tissue cells and lymphocytes attract monocytes and induce their differentiation into macrophages. During the differentiation process monocytes/macrophages release cytokines regulating their differentiation and activation in an autocrine/paracrine fashion.
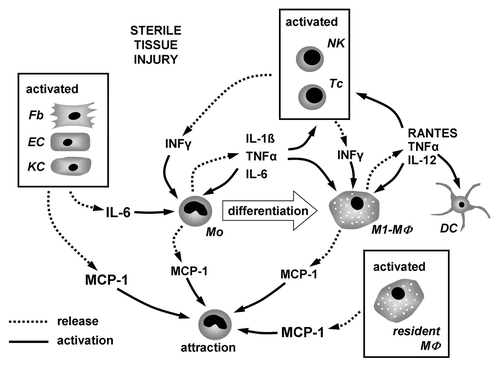
Figure 2. Characteristics of monocytes and MØCC, M1 and M2 macrophages. Monocytes (Mo) were differentiated on bsa in the presence of the cytokine cocktail (cc) consisting of MCP-1, IL-6 and IFNγ, or GM-CSF or M-CSF to generate MØCC, M1 or M2 macrophages, respectively. Representative micrographs (A) and dotplots (B) show fresh isolated monocytes and differentiated macrophages of day 6. (A) Representative micrographs depict Mo as small round cells. MØCC appear larger in size as Mo but still round-shaped and tend to form clusters which are fragile attached to the substrate. M1 appear as large, round cells. M2 display an elongated, spindle-shaped morphology. Scale bars represent 50 µm. Included details are 4× magnified. (B) MØCC, M1 and M2 display higher FSc properties as Mo demonstrating their increase in size, as it occurs during the process of monocyte to macrophage differentiation. (C) Expression of macrophage phenotype specific surface markers was analyzed on fresh isolated monocytes and on MØCC, M1 and M2 on day 6 of differentiation, respectively. Surface marker profile of MØCC is similar to that of M1 macrophages in respect of their expression of CD14, CD16, CD71 and CD163. Data are presented as mean ± SD of three independent experiments. *p < 0.05, **p < 0.01 and ***p < 0,001
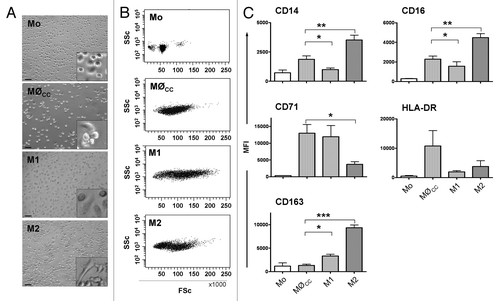
Figure 3. Morphology and viability of MØCC differentiated on aECM. Monocytes were differentiated to MØCC on bsa, coll or different aECMs (coll/HA, coll/lsHA, coll/hsHA) by stimulation with the cytokine cocktail (MCP-1, IL-6, IFNγ). (A) Representative micrographs out of three independent experiments from MØCC on day 6 are depicted. On all substrates MØCC are small, round shaped and only fragile attached. On coll, coll/HA and coll/lsHA MØCC form large clusters while on coll/hsHA MØCC appear predominantly as single cells. (B) Vitality of MØCC was determined on day 6 by labeling the cells with Annexin V (AnnxV) and propidium iodide (PI). Percentage of AnnxV-/PI- cells reflecting the population of viable cells is presented as mean ± SD of three independent experiments. No differences in the viabilty of the MØCC generated on the different substrates were observed.
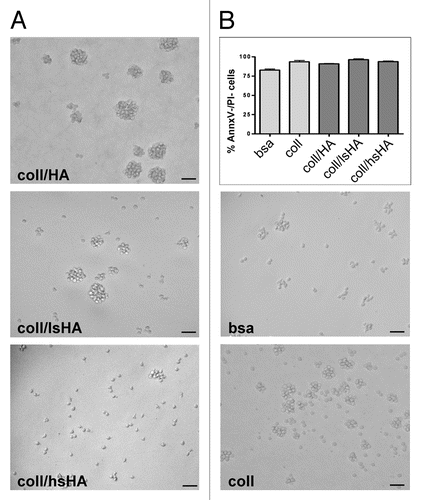
Figure 4. Surface marker profile of MØCC differentiated on aECM. Monocytes were differentiated to MØCC on bsa, coll or different aECMs. Expression of surface markers were analyzed on day one (A) and day 6 (B) of differentiation. Changes in the levels of surface marker expression on MØCC cultured on the different substrates are displayed relative to bsa. Of note is the remarkable induction of CD163 on MØCC differentiated for six days on coll/hsHA. All data are presented as mean ± SD of three independent experiments. *p < 0.05 (compared with bsa).
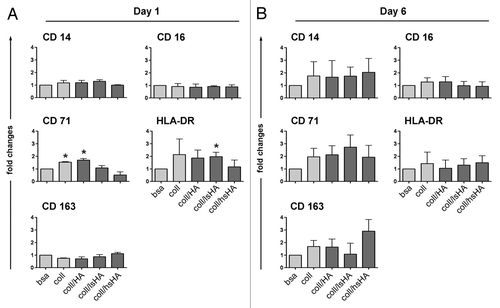
Figure 5. Early cytokine response of MØCC differentiated on aECM. Monocytes were induced to differentiate into MØCC on bsa, coll or different aECMs. On day one of differentiation, early cytokine response was determined after LPS stimulation for 5 h (TNFα) or 24 h (all other cytokines). (A) Inflammatory cytokines/chemokines IL-8, MCP-1, IL-1β, IL-6 and TNFα are secreted at high levels. (B) Changes in the levels of released cytokines are presented as fold recovery relative to bsa. MØCC cultured on coll/hsHA show reduced secretion of the early inflammatory cytokines IL-1β and TNFα and the chemoattractant IL-8 while release of chemoattractive MCP-1 is increased in these MØCC and in MØCC cultured coll/lsHA. Secretion of IL-6 in MØCC on all aECMs is similar to bsa and coll. All data are presented as mean ± SD of three to five independent experiments. *p < 0.05 and **p < 0.01.
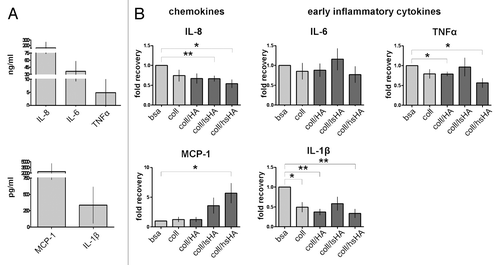
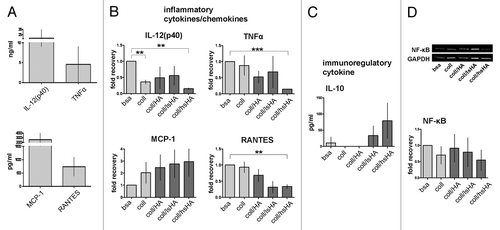
Figure 6. Late cytokine response of MØCC differentiated on aECM. Monocytes were differentiated into MØCC on bsa, coll or different aECMs. On day 6 of differentiation, cytokine response and NF-κB activation were evaluated after LPS stimulation for 20 min (NF-κB), 5 h (TNFa) or 24 h (all other cytokines). (A) MØCC differentiated on bsa release high levels of inflammatory cytokines/chemokines. (B) Changes in the levels of released cytokines are presented as fold recovery relative to bsa. Release of inflammatory cytokines IL-12(p40), RANTES and TNFα is reduced in MØCC on all aECM whereas levels of the chemokine MCP-1 are elevated. Altered cytokine/chemokine release is most pronounced and significant in MØCC on coll/hsHA. (C) MØCC on bsa produce little amounts of immunoregulatory IL-10 which are elevated in MØCC on coll/lsHA and coll/hsHA. (D) Activation of NF-κB is remarkably reduced in MØCC differentiated on coll/hsHA. Levels of NF-κB were determined by densitometric evaluation and calculation relative to GAPDH which was used as loading control. All data are presented as mean ± SD of three (NF-κB: five) independent experiments. *p < 0.05, **p < 0.01 and ***p < 0.001.