769
Views
22
CrossRef citations to date
0
Altmetric
Letter to the Editor

Phosphoproteomic analysis identifies insulin enhancement of discoidin domain receptor 2 phosphorylation

, &
Pages 161-164 | Received 24 Aug 2012, Accepted 16 Oct 2012, Published online: 15 Nov 2012

Figures & data

Figure 1. (A) Immunoblot of DDR2 activation from 0–60 min after stimulation with 20 µg/ml of collagen I. HEK293 control cells do not endogenously express DDR2. Cells engineered to express DDR2 display robust tyrosine phosphorylation upon exposure to collagen I. (B) Schematic of phosphoproteomic experimental strategy. HEK293-DDR2 cells were stimulated with acid (control), collagen I and/or insulin. Cells were then lysed, proteins digested and the resultant peptides were labeled with iTRAQ 8-plex isobaric reagents. Labeled peptides were subjected to phosphotyrosine immunoprecipitation and IMAC enrichment prior to LC/MS/MS. Phosphopeptides were sequenced and quantified as described in the methods. Mass spectrum of IRS2 Y675 highlights the peak areas for the iTRAQ 8-plex marker ions which enable quantification of phosphorylation levels for each condition. Experiments were performed in two biological replicates. (C) Scatterplot to illustrate the reproducibility of biological replicate experiments with log 10 iTRAQ ratios for the phosphoproteomic data. (D) Hierarchical clustering analysis of phosphoproteomic data comprising of 22 phosphorylation sites by Euclidean distance. Each column represents the relative phosphorylation levels in each of the four stimulation conditions (average of two biological replicates) normalized to the co-stimulation of collagen I and insulin. (E) Plot of the two biological replicates of DDR2 Y740 upon stimulation with collagen I and/or insulin. Measurements are expressed relative to the acid control. (F) Immunoblot of DDR2 phosphorylation in HEK293-DDR2 cells across 1 to 4 h after stimulation with the indicated ligands show that phosphorylation of DDR2 Y740 and total receptor tyrosine phosphorylation levels (4G10 antibody) are increased when co-stimulated with collagen and insulin compared with collagen I alone.
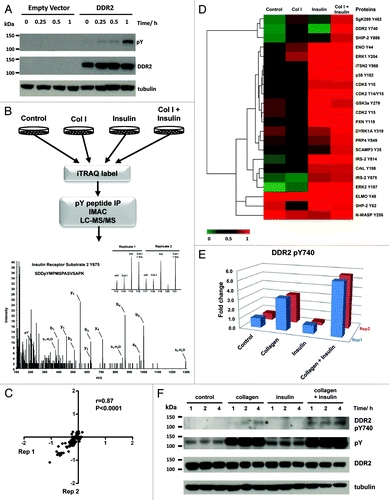
Figure 1. (A) Immunoblot of DDR2 activation from 0–60 min after stimulation with 20 µg/ml of collagen I. HEK293 control cells do not endogenously express DDR2. Cells engineered to express DDR2 display robust tyrosine phosphorylation upon exposure to collagen I. (B) Schematic of phosphoproteomic experimental strategy. HEK293-DDR2 cells were stimulated with acid (control), collagen I and/or insulin. Cells were then lysed, proteins digested and the resultant peptides were labeled with iTRAQ 8-plex isobaric reagents. Labeled peptides were subjected to phosphotyrosine immunoprecipitation and IMAC enrichment prior to LC/MS/MS. Phosphopeptides were sequenced and quantified as described in the methods. Mass spectrum of IRS2 Y675 highlights the peak areas for the iTRAQ 8-plex marker ions which enable quantification of phosphorylation levels for each condition. Experiments were performed in two biological replicates. (C) Scatterplot to illustrate the reproducibility of biological replicate experiments with log 10 iTRAQ ratios for the phosphoproteomic data. (D) Hierarchical clustering analysis of phosphoproteomic data comprising of 22 phosphorylation sites by Euclidean distance. Each column represents the relative phosphorylation levels in each of the four stimulation conditions (average of two biological replicates) normalized to the co-stimulation of collagen I and insulin. (E) Plot of the two biological replicates of DDR2 Y740 upon stimulation with collagen I and/or insulin. Measurements are expressed relative to the acid control. (F) Immunoblot of DDR2 phosphorylation in HEK293-DDR2 cells across 1 to 4 h after stimulation with the indicated ligands show that phosphorylation of DDR2 Y740 and total receptor tyrosine phosphorylation levels (4G10 antibody) are increased when co-stimulated with collagen and insulin compared with collagen I alone.
Supplemental material

Additional material

Download Zip (148.4 KB)