1,478
Views
43
CrossRef citations to date
0
Altmetric
Research Paper

Inhibitive effect of purple sweet potato leaf extract and its components on cell adhesion and inflammatory response in human aortic endothelial cells

, &
Pages 237-245 | Received 03 Sep 2012, Accepted 17 Jan 2013, Published online: 01 Mar 2013

Figures & data

Figure 1. Effects of PSPLE and its components on monocyte-endothelial cell adhesion. (A) Representative fluorescent photomicrographs showing the inhibitive effect of pretreatment with 10 µM aspirin, cyanidin or quercetin or 100 µg/mL PSPLE on TNF-α-induced adhesion of fluorescein-labeled U937 cells to human aortic endothelial cells. (B) Summary and statistical analysis of the adhesion assay data in (A). # indicates a significant difference between the TNF-α and control groups, p < 0.05. * indicates a significant difference between the TNF-α and experimental treatment groups, p < 0.05.
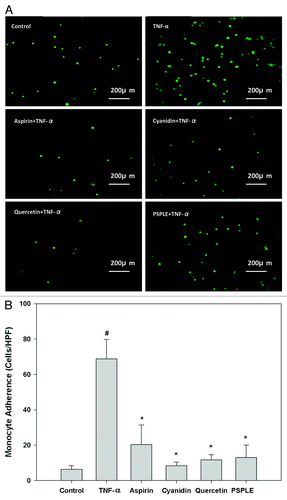
Figure 1. Effects of PSPLE and its components on monocyte-endothelial cell adhesion. (A) Representative fluorescent photomicrographs showing the inhibitive effect of pretreatment with 10 µM aspirin, cyanidin or quercetin or 100 µg/mL PSPLE on TNF-α-induced adhesion of fluorescein-labeled U937 cells to human aortic endothelial cells. (B) Summary and statistical analysis of the adhesion assay data in (A). # indicates a significant difference between the TNF-α and control groups, p < 0.05. * indicates a significant difference between the TNF-α and experimental treatment groups, p < 0.05.
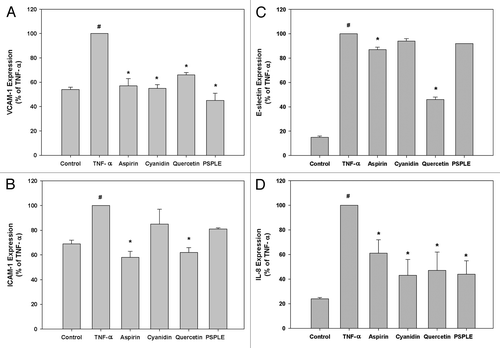
Figure 2. Effects of PSPLE and its components on expression of adhesion molecules. VCAM-1 (A), ICAM-1 (B), E-selectin (C) and IL-8 (D) expression was determined by ELISA. HAECs were pre-incubated with the indicated samples followed by TNF-α for 6 h. Data are expressed as the mean ± SD of three experiments. # indicates a significant difference between the TNF-α treatment and control group, p < 0.05. * indicates a significant difference between the TNF-α and experimental treatment groups, p < 0.05.
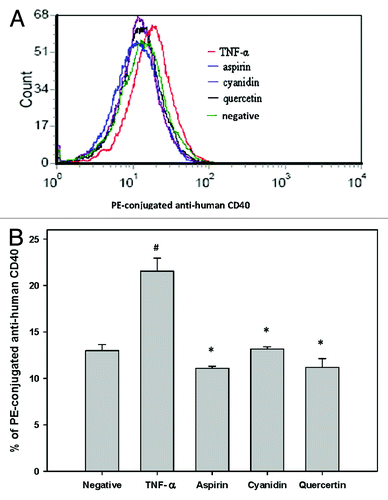
Figure 2. Effects of PSPLE and its components on expression of adhesion molecules. VCAM-1 (A), ICAM-1 (B), E-selectin (C) and IL-8 (D) expression was determined by ELISA. HAECs were pre-incubated with the indicated samples followed by TNF-α for 6 h. Data are expressed as the mean ± SD of three experiments. # indicates a significant difference between the TNF-α treatment and control group, p < 0.05. * indicates a significant difference between the TNF-α and experimental treatment groups, p < 0.05.
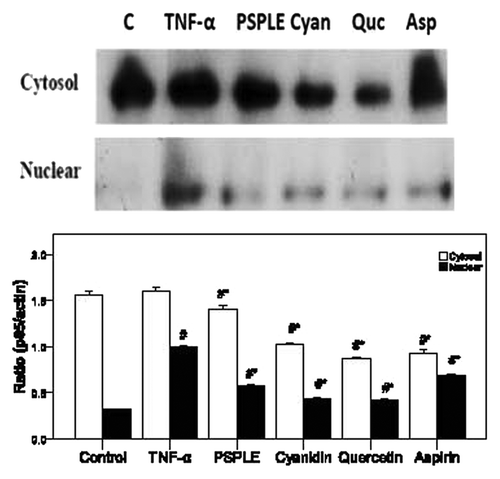
Figure 3. Reduced CD40 expression in response to PSPLE components. (A) CD40 expression in untreated cells (green), TNF-α treated cells (red), aspirin treated cells (blue), quercetin treated cells (black) and cyanidin treated cells (purple) was quantified by flow cytometry. (B) Data are expressed as the mean ± SD of three experiments. # indicates a significant difference between the TNF-α treatment and control group, p < 0.05. * indicates a significant difference between the TNF-α and experimental treatment groups, p < 0.05.

Figure 3. Reduced CD40 expression in response to PSPLE components. (A) CD40 expression in untreated cells (green), TNF-α treated cells (red), aspirin treated cells (blue), quercetin treated cells (black) and cyanidin treated cells (purple) was quantified by flow cytometry. (B) Data are expressed as the mean ± SD of three experiments. # indicates a significant difference between the TNF-α treatment and control group, p < 0.05. * indicates a significant difference between the TNF-α and experimental treatment groups, p < 0.05.

Figure 4. Effects of PSPLE and its components on NFκB activity. After HAECs were pretreated with the indicated samples then incubated with TNF-α, cytosolic and nuclear extracts were prepared, and the expression of NFκB p65 was assessed by western blot analysis. A representative image of three similar results is shown (upper panel). Actin served as the loading control for the cytosolic compartment while hnPNPc1/c2 was used for the nuclear extract. Semi-quantitative analysis of three independent experiments are also shown (lower panel). # indicates a significant difference between the TNF-α treatment and control groups, p < 0.05. * indicates a significant difference between the TNF-α and experimental treatment groups, p < 0.05.

Figure 4. Effects of PSPLE and its components on NFκB activity. After HAECs were pretreated with the indicated samples then incubated with TNF-α, cytosolic and nuclear extracts were prepared, and the expression of NFκB p65 was assessed by western blot analysis. A representative image of three similar results is shown (upper panel). Actin served as the loading control for the cytosolic compartment while hnPNPc1/c2 was used for the nuclear extract. Semi-quantitative analysis of three independent experiments are also shown (lower panel). # indicates a significant difference between the TNF-α treatment and control groups, p < 0.05. * indicates a significant difference between the TNF-α and experimental treatment groups, p < 0.05.

Figure 5. Quercetin and cyanidin inhibit binding of NFκB to target DNA sequence. NFκB, (A) AP-1 (B) and STAT3 (C) transcription factor-DNA interactions were assessed by EMSA using IRDye 700 end-labeled oligonucleotide duplexes.
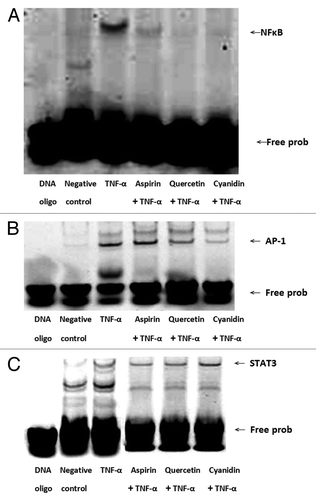
Figure 5. Quercetin and cyanidin inhibit binding of NFκB to target DNA sequence. NFκB, (A) AP-1 (B) and STAT3 (C) transcription factor-DNA interactions were assessed by EMSA using IRDye 700 end-labeled oligonucleotide duplexes.

Figure 6. PSPL components reduce ERK and p38 MAPK signaling. Expression of (A) ERK-1 and ERK-2 as well as (B) p38MAPK in treated HAECs was determined using western blot analysis. α-tubulin expression was used as the loading control. A representative image of three similar results is shown. Semi-quantitative analysis of three independent experiments are also shown (bottom panel). # indicates a significant difference between the TNF-α treatment and control groups, p < 0.05. * indicates a significant difference between the TNF-α and experimental treatment groups, p < 0.05.
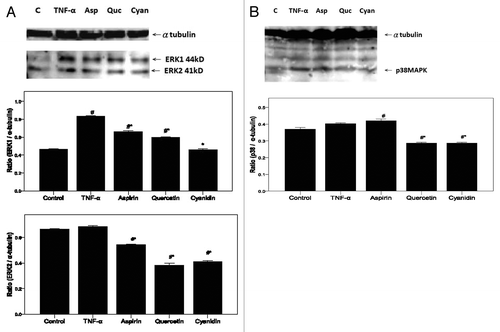
Figure 6. PSPL components reduce ERK and p38 MAPK signaling. Expression of (A) ERK-1 and ERK-2 as well as (B) p38MAPK in treated HAECs was determined using western blot analysis. α-tubulin expression was used as the loading control. A representative image of three similar results is shown. Semi-quantitative analysis of three independent experiments are also shown (bottom panel). # indicates a significant difference between the TNF-α treatment and control groups, p < 0.05. * indicates a significant difference between the TNF-α and experimental treatment groups, p < 0.05.

Figure 7. The mechanism by which PSPLE and its components influence redox-sensitive signaling pathways in endothelial cells. The antioxidative components of PSPLE, quercetin and cyanidin, may downregulate intracellular redox-dependent signaling pathways in HAECs upon TNF-α stimulation, which may prevent ROS-mediated endothelial cell dysfunction.
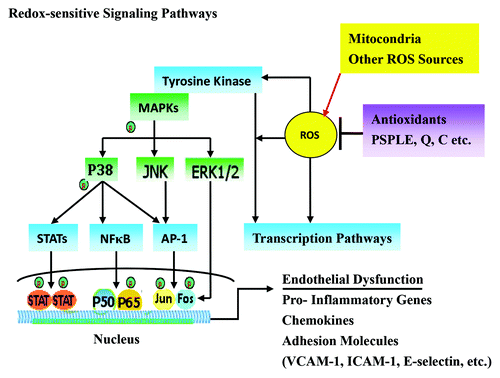
Figure 7. The mechanism by which PSPLE and its components influence redox-sensitive signaling pathways in endothelial cells. The antioxidative components of PSPLE, quercetin and cyanidin, may downregulate intracellular redox-dependent signaling pathways in HAECs upon TNF-α stimulation, which may prevent ROS-mediated endothelial cell dysfunction.

Reprints and Corporate Permissions

Please note: Selecting permissions does not provide access to the full text of the article, please see our help page How do I view content?

To request a reprint or corporate permissions for this article, please click on the relevant link below:

Academic Permissions

Please note: Selecting permissions does not provide access to the full text of the article, please see our help page How do I view content?

Obtain permissions instantly via Rightslink by clicking on the button below:

If you are unable to obtain permissions via Rightslink, please complete and submit this Permissions form. For more information, please visit our Permissions help page.