685
Views
9
CrossRef citations to date
0
Altmetric
Research Paper

α6 integrin subunit regulates cerebellar development

, , &
Pages 325-332 | Received 16 May 2013, Accepted 22 May 2013, Published online: 24 May 2013

Figures & data

Figure 1. Specific deletion of α6 integrin subunit in mouse nervous system. (A) DNA was obtained from brain of control and mutant mice at P0 and analyzed by PCR for Cre-mediated recombination. The 154 bp band corresponds to the α6-floxed allele (fl) and the 120 bp band to the wild type allele (+). A 1 kb band, indicating the α6-deleted allele, was present only in the α6fl/fl;nestin-Cre brain. Primers against Cre were used to confirm the presence of nestin-Cre transgene. (B) Western blot analysis for α6 integrin in P7 brains and cerebellum. The α6 protein was detected in control mice whereas, in the α6fl/fl;nestin-Cre mice where it was expressed in very low amounts. GAPDH was used as a loading control. (C) P17 telencephalon coronal and P21 cerebellum sagittal sections of control and α6fl/fl;nestin-Cre mice stained with hematoxylin and eosin. The arrows indicate a partial defect in the formation of fissures between lobules I/II-III and VI-VII in the α6fl/fl;nestin-Cre mice. St, striatum; Se, septum; NCx, neocortex. Scale bar, 200 μm.
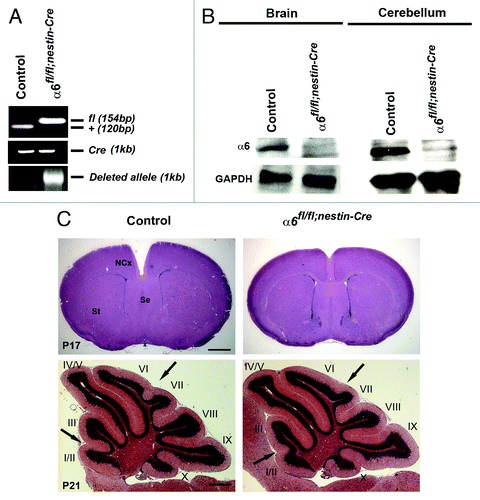
Figure 1. Specific deletion of α6 integrin subunit in mouse nervous system. (A) DNA was obtained from brain of control and mutant mice at P0 and analyzed by PCR for Cre-mediated recombination. The 154 bp band corresponds to the α6-floxed allele (fl) and the 120 bp band to the wild type allele (+). A 1 kb band, indicating the α6-deleted allele, was present only in the α6fl/fl;nestin-Cre brain. Primers against Cre were used to confirm the presence of nestin-Cre transgene. (B) Western blot analysis for α6 integrin in P7 brains and cerebellum. The α6 protein was detected in control mice whereas, in the α6fl/fl;nestin-Cre mice where it was expressed in very low amounts. GAPDH was used as a loading control. (C) P17 telencephalon coronal and P21 cerebellum sagittal sections of control and α6fl/fl;nestin-Cre mice stained with hematoxylin and eosin. The arrows indicate a partial defect in the formation of fissures between lobules I/II-III and VI-VII in the α6fl/fl;nestin-Cre mice. St, striatum; Se, septum; NCx, neocortex. Scale bar, 200 μm.

Figure 2. Expression of the integrin α6 subunit mRNA in the P10 mouse cerebellum. (A) In situ hybridization analysis of the α6 integrin mRNA on sagittal sections of P10 mouse cerebellum. The α6 mRNA was present in the PCL. Scale bar, 100 µm. (B) High magnification view of the boxed area in (A) showed a strong expression in the cell bodies of Purkinje cells (arrows). Scale bar, 40 µm. EGL, external granular layer; ML, molecular layer; PCL, Purkinje cellular layer; IGL, internal granular layer.
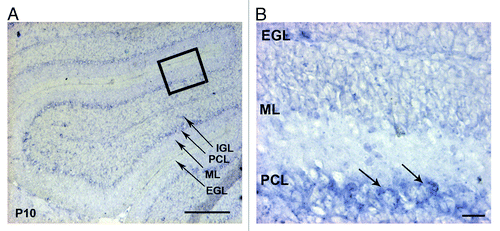
Figure 2. Expression of the integrin α6 subunit mRNA in the P10 mouse cerebellum. (A) In situ hybridization analysis of the α6 integrin mRNA on sagittal sections of P10 mouse cerebellum. The α6 mRNA was present in the PCL. Scale bar, 100 µm. (B) High magnification view of the boxed area in (A) showed a strong expression in the cell bodies of Purkinje cells (arrows). Scale bar, 40 µm. EGL, external granular layer; ML, molecular layer; PCL, Purkinje cellular layer; IGL, internal granular layer.
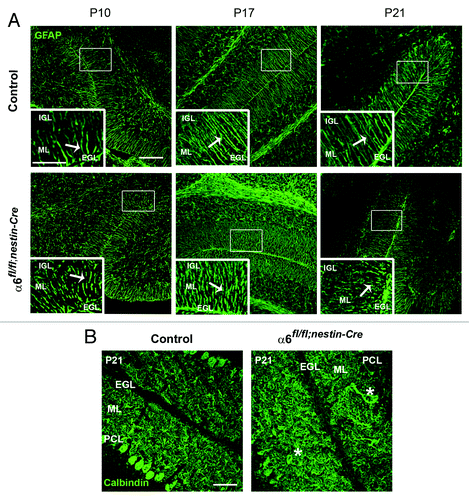
Figure 3. Defects in Bergmann glial fibers morphology and Purkinje cell position. (A) Staining with anti-GFAP antibody on sagittal sections from P10, P17, and P21 control and α6fl/fl;nestin-Cre cerebellum to reveal Bergmann glial fibers. In the control samples the glial processes normally extended through the ML and branched to the basement membrane. In contrast, the glial fibers lacking α6 integrin appeared irregular with abnormal extensions. Glial fiber morphology is shown in each panel in high magnification views of the corresponding boxed area. The white arrows indicate the glial fibers. Scale bars, 100 μm; 20 μm. (B) P21 sagittal cerebellar sections stained with an anti-calbindin antibody to visualize Purkinje cells. In the control mice, Purkinje cells were aligned along the PCL, whereas in the α6fl/fl;nestin-Cre mice, some Purkinje cell bodies were ectopically localized in the ML. The asterisks indicate the mispositioned Purkinje cell in the mutant cerebellum. Scale bar, 50 μm. EGL, external granular layer; ML, molecular layer; PCL, Purkinje cellular layer; IGL, internal granular layer.

Figure 3. Defects in Bergmann glial fibers morphology and Purkinje cell position. (A) Staining with anti-GFAP antibody on sagittal sections from P10, P17, and P21 control and α6fl/fl;nestin-Cre cerebellum to reveal Bergmann glial fibers. In the control samples the glial processes normally extended through the ML and branched to the basement membrane. In contrast, the glial fibers lacking α6 integrin appeared irregular with abnormal extensions. Glial fiber morphology is shown in each panel in high magnification views of the corresponding boxed area. The white arrows indicate the glial fibers. Scale bars, 100 μm; 20 μm. (B) P21 sagittal cerebellar sections stained with an anti-calbindin antibody to visualize Purkinje cells. In the control mice, Purkinje cells were aligned along the PCL, whereas in the α6fl/fl;nestin-Cre mice, some Purkinje cell bodies were ectopically localized in the ML. The asterisks indicate the mispositioned Purkinje cell in the mutant cerebellum. Scale bar, 50 μm. EGL, external granular layer; ML, molecular layer; PCL, Purkinje cellular layer; IGL, internal granular layer.

Figure 4. Analyses of glial endfeet formation and basement membrane structure. P21 sagittal sections from control and mutant cerebellum were double stained for GFAP (green) and laminin γ1 (red). Higher magnification view of the areas, indicated by the white square, did not show gross defects in the attachment of glial fibers to the basement membrane in the mutant mice compared with the control sample.
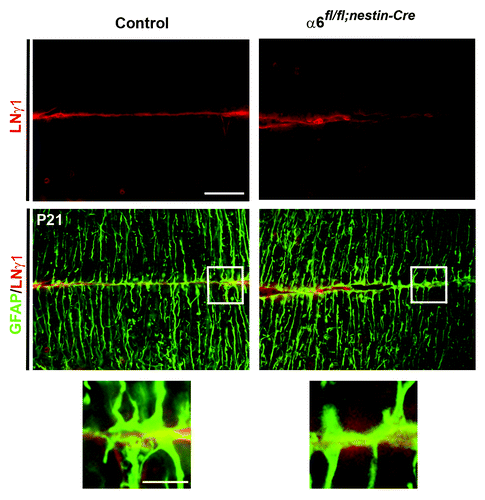
Figure 4. Analyses of glial endfeet formation and basement membrane structure. P21 sagittal sections from control and mutant cerebellum were double stained for GFAP (green) and laminin γ1 (red). Higher magnification view of the areas, indicated by the white square, did not show gross defects in the attachment of glial fibers to the basement membrane in the mutant mice compared with the control sample.

Figure 5. Absence of α6 integrin subunit impairs process outgrowth in Bergmann glial growth cones. (A and B) Primary cerebellar glial cells were plated onto LN/Poly-D-Lysine substrates and analyzed by immunostaining. (A) Detection of α6 integrin subunit (green) and the glial marker BLBP (red).The α6 integrin subunit was expressed throughout glial fibers and located at the tip of glial processes. Insets represent enlargements of the glial process (arrow). Scale bars, 20 μm, 2.4 μm. (B) Immunostaining of GFAP (red) and actin (visualized by staining with phalloidin) (green). Control cells showed actin accumulation at level of the membrane ruffles and the tips of growth cone. By contrast, in α6-deficient glial cells the cell periphery and the leading edge of glial growth cone contained reduced actin amounts. The arrows indicate sites of actin accumulation in the glial cells. Scale bar, 20 μm. (C) Quantification of growth cone area measurements in control and α6fl/fl;nestin-Cre glial cells (n = 10, Student t test ***P < 0.001).
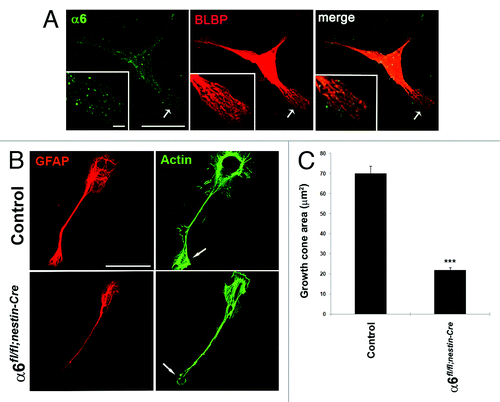
Figure 5. Absence of α6 integrin subunit impairs process outgrowth in Bergmann glial growth cones. (A and B) Primary cerebellar glial cells were plated onto LN/Poly-D-Lysine substrates and analyzed by immunostaining. (A) Detection of α6 integrin subunit (green) and the glial marker BLBP (red).The α6 integrin subunit was expressed throughout glial fibers and located at the tip of glial processes. Insets represent enlargements of the glial process (arrow). Scale bars, 20 μm, 2.4 μm. (B) Immunostaining of GFAP (red) and actin (visualized by staining with phalloidin) (green). Control cells showed actin accumulation at level of the membrane ruffles and the tips of growth cone. By contrast, in α6-deficient glial cells the cell periphery and the leading edge of glial growth cone contained reduced actin amounts. The arrows indicate sites of actin accumulation in the glial cells. Scale bar, 20 μm. (C) Quantification of growth cone area measurements in control and α6fl/fl;nestin-Cre glial cells (n = 10, Student t test ***P < 0.001).

Figure 6. Granule cell migration occurred normally in the α6fl/fl;nestin-Cre mice. (A) Dividing granule cells in P10 control and α6fl/fl;nestin-Cre littermates were labeled by systemic injection of BrdU. Cerebellar tissue was then collected and processed for BrdU immunohistochemistry at the indicated post-injection times. Twenty-four hours post-BrdU labeling, the granule migration had not yet begun. Forty-eight hours post-BrdU injection the BrdU-positive cells were migrating from the EGL, through the ML, to reach the IGL. Scale bar, 40 µm. (B) Laminar distribution of migrating granular cells in cerebellum from P12 control and α6fl/fl;nestin-Cre mice, 48 h after BrdU injection. Four sections were counted per animal (2 controls and 3 mutants). The percentage of BrdU-labeled cells in each layer was not significantly different in control compared with mutant mice. Error bars indicate SD. Scale bar, 50 μm. EGL, external granular layer; ML, molecular layer; IGL, internal granular layer.
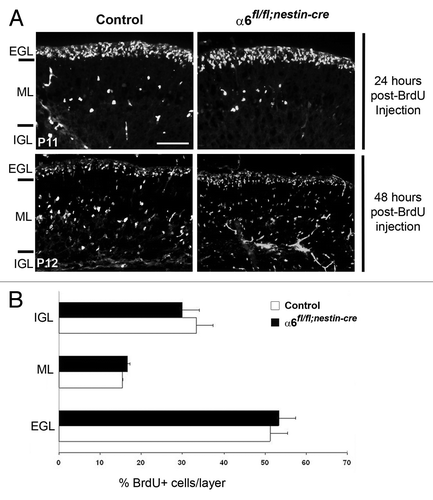
Figure 6. Granule cell migration occurred normally in the α6fl/fl;nestin-Cre mice. (A) Dividing granule cells in P10 control and α6fl/fl;nestin-Cre littermates were labeled by systemic injection of BrdU. Cerebellar tissue was then collected and processed for BrdU immunohistochemistry at the indicated post-injection times. Twenty-four hours post-BrdU labeling, the granule migration had not yet begun. Forty-eight hours post-BrdU injection the BrdU-positive cells were migrating from the EGL, through the ML, to reach the IGL. Scale bar, 40 µm. (B) Laminar distribution of migrating granular cells in cerebellum from P12 control and α6fl/fl;nestin-Cre mice, 48 h after BrdU injection. Four sections were counted per animal (2 controls and 3 mutants). The percentage of BrdU-labeled cells in each layer was not significantly different in control compared with mutant mice. Error bars indicate SD. Scale bar, 50 μm. EGL, external granular layer; ML, molecular layer; IGL, internal granular layer.
Supplemental material

Additional material

Download Zip (2.7 MB)

Reprints and Corporate Permissions

Please note: Selecting permissions does not provide access to the full text of the article, please see our help page How do I view content?

To request a reprint or corporate permissions for this article, please click on the relevant link below:

Academic Permissions

Please note: Selecting permissions does not provide access to the full text of the article, please see our help page How do I view content?

Obtain permissions instantly via Rightslink by clicking on the button below:

If you are unable to obtain permissions via Rightslink, please complete and submit this Permissions form. For more information, please visit our Permissions help page.