Figures & data
Figure 1. HSPC adhere to BIGH3 in static adhesion assays, dependent on β1- and β2-integrins. (A) The percentage static adhesion of MPB-derived HSPCs of six mobilized donors on plastic coated by BSA (2%), BIGH3 (10 μg/mL), or fibronectin (FN, 20 μg/mL). The percentage adhesion was calculated by the absorbance of a well relative to the absorbance of a 100% input control. (B) The percentage static adhesion of MPB-derived HSPCs on a BIGH3 (10 μg/mL) coating, in the presence of functional blocking antibodies against the indicated integrin subunits. Statistics were performed based on the percentage adhesion with the indicated antibody relative to that without antibodies. Blocking antibodies against β1- and β2-integrins inhibit the static adhesion of HSPCs to BIGH3. Shown are means ± SEM (n = 6) and each samples was performed in duplicates. * P < 0.05, ** P < 0.01.
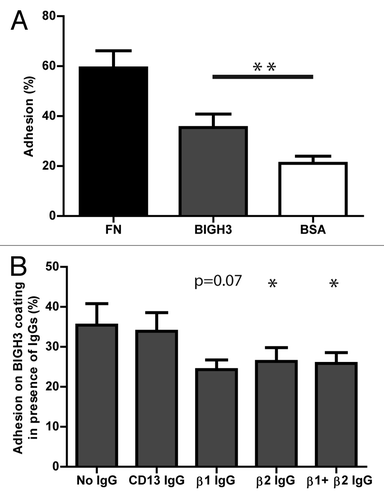
Figure 2. BIGH3 is secreted by cells with BIGH3 overexpression and internalized by wild-type cells. L60 cells with BIGH3 overexpression (BIG) were mixed with non-transduced (NT) cells in various ratios (50:50, 25:75, and 10:90) and co-cultured during 5 d. A condition with NT cells cultured during 5 d in conditioned medium from cells with BIGH3 overexpression (NT + BIGsup) was taken along. (A) Western blot with cell lysates and supernatants of the mixtures of HL60 cells, stained for BIGH3 (right panel, representative experiment, n = 3). An equal number of input cells were used for the cell lysates in each lane. The proteins in the medium (Supernatants) were precipitated and an amount corresponding to 2 × 10⁵ cells was used in each lane. The lanes on Western Blot were quantified by use of ImageJ software (left panel). With decreasing fractions of cells with BIGH3 overexpression, the amount of BIGH3 in the cell lysates is disproportionably stable, while the amount of BIGH3 in the supernatants is disproportionably fast decreasing. Shown are means ± SEM (n = 3). (B and C) Flow cytometry for BIGH3 expression in the mixtures, depicted as the percentage BIGH3-positive cells in the GFP-positive fraction (cells with BIGH3 overexpression; GFP-positive) and the GFP-negative fraction (wild-type cells; GFP-negative), by intercellular staining, indicating the internalization (B) and by surface staining, indicating the surface binding (C). The cells were considered BIGH3-positive if the BIGH3 signal exceeded the background signal in empty-vector transduced control cells (EV) and NT cells, stained for BIGH3. Shown are means ± SEM (n = 3). (D) The percentage of transduced cells in the mixtures was verified by flow cytometry for GFP, and reflected the input ratios. Shown are means ± SEM (n = 3).
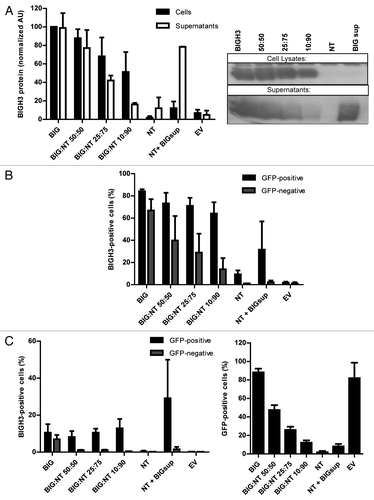
Figure 3. Overexpression of BIGH3 inhibits the static adhesion of HL60 cells and HSPCs. The percentage adhesion of HL60 cells (A) or HSPCs (B) with BIGH3 overexpression (BIGH3), with empty-vector (EV) and non-transduced cells (NT) on a fibronectin (20 μg/mL, FN), BSA (2%), or BIGH3 (10 μg/mL) coating. The HSPC were incubated in the presence (PMA) or absence of PMA during the adhesion period. The percentage adhesion was calculated by the absorbance of a well relative to the absorbance of the 100% input control of the corresponding cell type. Shown are means ± SEM (n = 7 in A, n = 4 in B) and each samples was performed in duplicates. * P < 0.05, ns, not significant.
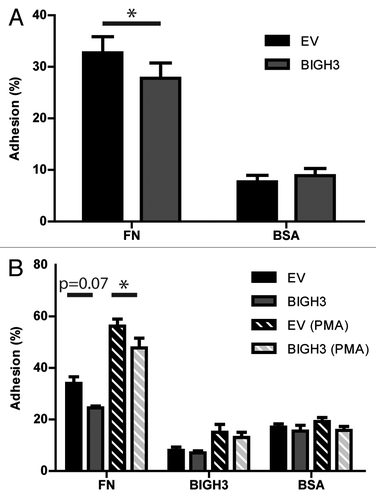
Figure 4. Overexpression of BIGH3 decreases transcellular resistance after PMA induction. (A and B) The transcellular resistance of HL60 cells with BIGH3 overexpression and control cells (EV) on a fibronectin (20 μg/mL) coating (A) or poly-l-lysine coating (B) was analyzed by Electrical Cell-substrate Impedence Sensing (ECIS). PMA was added at time point zero. The resulted resistance-values were normalized to basal levels. Shown are means ± SEM (n = 6 in [A], n = 4 in [B]) and each samples was performed in duplicates. (C) The transcellular resistance of PB-derived HSPC with BIGH3 overexpression and control cells on fibronectin (20 μg/mL) upon PMA induction was analyzed by ECIS. Shown are means ± SEM (n = 3) and each samples was performed in duplicates. (D) Cell spreading of HL60 cells with BIGH3 overexpression (BIGH3) and control cells (EV) was analyzed by live-imaging microscopy. The surfaces of 10 randomly selected cells per condition were quantified during time. The data was normalized per cell to basal surface size. Shown are means ± SEM (n = 6 in BIGH3, n = 5 in control). * P < 0.05.
![Figure 4. Overexpression of BIGH3 decreases transcellular resistance after PMA induction. (A and B) The transcellular resistance of HL60 cells with BIGH3 overexpression and control cells (EV) on a fibronectin (20 μg/mL) coating (A) or poly-l-lysine coating (B) was analyzed by Electrical Cell-substrate Impedence Sensing (ECIS). PMA was added at time point zero. The resulted resistance-values were normalized to basal levels. Shown are means ± SEM (n = 6 in [A], n = 4 in [B]) and each samples was performed in duplicates. (C) The transcellular resistance of PB-derived HSPC with BIGH3 overexpression and control cells on fibronectin (20 μg/mL) upon PMA induction was analyzed by ECIS. Shown are means ± SEM (n = 3) and each samples was performed in duplicates. (D) Cell spreading of HL60 cells with BIGH3 overexpression (BIGH3) and control cells (EV) was analyzed by live-imaging microscopy. The surfaces of 10 randomly selected cells per condition were quantified during time. The data was normalized per cell to basal surface size. Shown are means ± SEM (n = 6 in BIGH3, n = 5 in control). * P < 0.05.](/cms/asset/d08f2acf-ba6f-4c34-a235-56e641cfe9e1/kcam_a_10926596_f0004.gif)
Figure 5. Overexpression of BIGH3 inhibits the migration of HL60 cells toward CXCL12. Dose-dependent Transwell-based migration of HL60 cells with BIGH3 overexpression and control cells (EV). The cells in the upper compartment were allowed for 4 h to migrate through 5 μm pores toward CXCL12 in the lower compartment. The transmigrated cells were collected and quantified by flow cytometry and quantification beads. (A) The percentage migration was calculated by the ratio of cells and beads relative to this ratio in the 100% input control of the corresponding cell type. (B) Spontaneous migration of HL60 cells with BIGH3 overexpression and control cells (EV). (C) Horizontal TaxiScan-based migration of HL60 cells with BIGH3 overexpression and control cells toward a CXCL12-gradient, equivalent to 100 ng/mL in Transwell-based migration. The percentage migrating cells was quantified by the fraction of cells that migrated at least 50 pixels. (D) Considering the migrating cells, the total migration distance per cell was quantified by depiction of the migration-path per cell. In addition, the directed migration distance of the migrating cells was quantified in the direction of the CXCL12-gradient. Shown are means ± SEM (n = 4; P = 0.03 at t = 30, t = 100 and t = 300; P = 0.04 at t = 0) and samples were performed in duplicates. * P < 0.05.
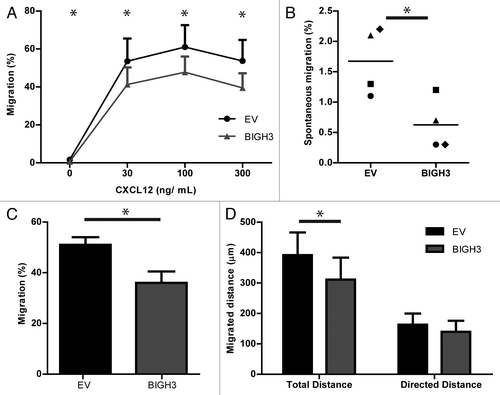
Figure 6. Overexpression of BIGH3 does not influence F-actin formation in HL60 cells upon CXCL12 treatment, but modifies the adhesive cell morphology. (A) The time course of CXCL12-induced F-actin formation in HL60 cells with BIGH3 overexpression and control cells was analyzed by flow cytometry. The mean fluorescence intensity (MFI) was normalized relative to basal MFI levels. Shown are means ± SEM (n = 3) and samples were performed in duplicates. (B and C) Confocal imaging of HL60 cells with BIGH3 overexpression (B) and control vector expression (C) 60 min after PMA stimulation. The adherent cells were fixed, permealized, and stained for F-actin (green), β1-integrin (red), and Hoechst (blue). Projections of Z-stacks are shown in upper panels of (B and C). Depth-analyses were performed based on the β1-integrin signal, shown in the lower panels of (B and C). The adhesive structures at the cell boundaries appear deeper (more yellow) in control cells compared with cells with BIGH3 overexpression. Four representative cells are shown for each condition, out of two independent experiments. Scaling is indicated by a white bar in the lower left corner, representing 5 μm. (D) The maximal length of cell and nucleus (red lines in projections) and the maximal height (white lines in cross sections) were determined (representative example). (E) The maximal length and height of cell and nucleus from HL60 cells with BIGH3 overexpression and control cells. The cells with BIGH3 overexpression appear flatter and have a slightly bigger nuclear diameter, although the maximal cellular diameter is not changed. This indicates BIGH3 induces structural changes in cell morphology. Shown are means ± SEM (n = 20). * P < 0.05, ** P < 0.01, ns, not significant.
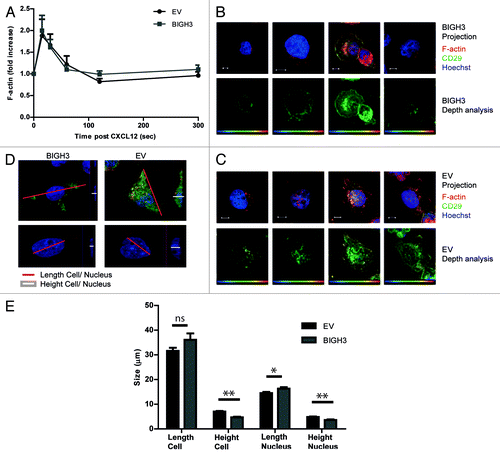
Figure 7. Overexpression of BIGH3 impairs the RAC1 activation by PMA. To study the activation of RAC1, a CRIB-peptide pool-down for endogenous RAC1-GTP was performed in HL60 cells with BIGH3 overexpression and control cells (EV). (A) Activated RAC1 was detected by immunoblotting in total cell lysates (total RAC1) and in CRIB-peptide pool-down lysates (RAC1-GTP). A representative experiment is shown. (B) Quantification of activated RAC1 normalized for the total RAC1 content. Shown are means ± SEM (n = 4). * P < 0.05
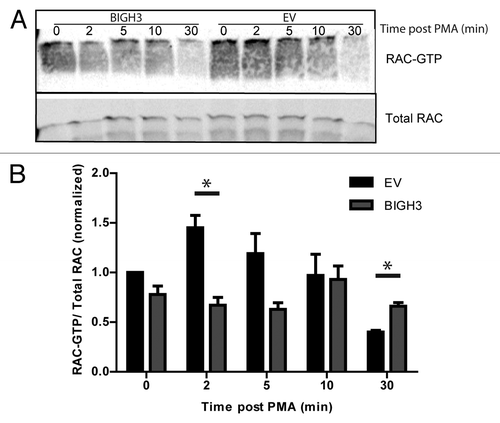
Figure 8. Overexpression of BIGH3 reduces ERK1 and ERK2 protein phosphorylation. The NanoPro Assay was used to quantify ERK expression and phosphorylation. (A) Peaks represent phosphorylated or unphosphorylated ERK1 or ERK2 protein levels, as indicated, in HL60 cells (A–C) or HSPCs (D). Shown are the samples at t = 10 min from a representative experiment. (B) The generated peaks are transformed in a western-blot-like representation of the data. The band intensity represents (phospho-)ERK protein levels. (C) The phosphorylated ERK1 (left panel) and ERK2 (right panel) protein levels as percentage of total ERK1 or ERK2 expression, respectively, in HL60 cells with BIGH3 overexpression or control cells (EV) were depicted. In resting state, the unphosphorylated isoforms are dominant. Shown are means ± SEM (n = 3). (D) The phosphorylated ERK1 (left panel) and ERK2 (right panel) protein levels were analyzed in HSPCs with BIGH3 overexpression or control cells (EV). Data in each experiment was normalized to the signal in control cells 60 min after PMA treatment. Shown are means ± SEM (n = 3). * P < 0.05
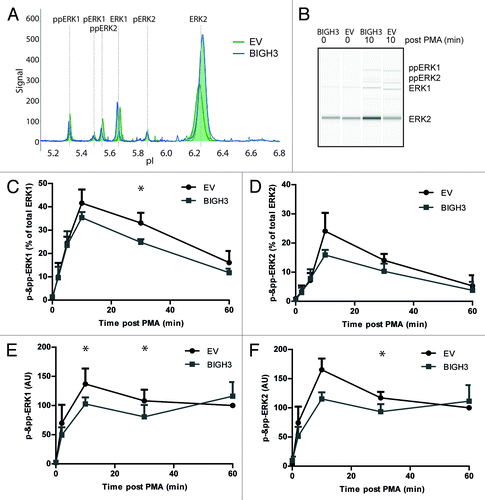
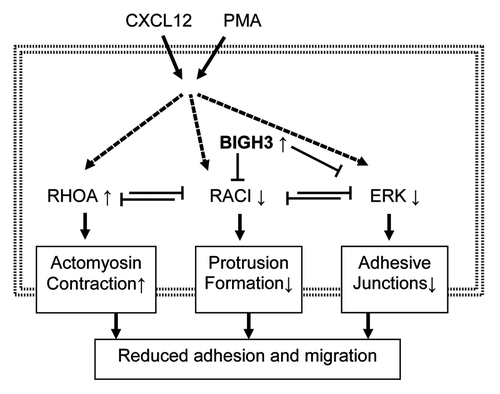
Figure 9. Overexpression of BIGH3 reduces adhesion and migration via RAC1 and ERK responses. We propose that induced BIGH3 expression inhibits RAC1 and ERK activation. As RAC1 and RhoA are mutual repressive, the phenotype of cells with high BIGH3 expression switch toward more actomyosin contraction and reduced protrusion formation. The reduced ERK activity may results in reduced FAK activity and a lower stability of adhesive junctions. Ultimately, high BIGH3 expression results in reduced cell adhesion and migration. Bold arrows represent activation or induction; dashed lines indicate indirect relationships; small arrows behind proteins indicate increased or decreased activation or expression levels in BIGH3-overexpressing cells.
