1,663
Views
25
CrossRef citations to date
0
Altmetric
RESEARCH PAPER

Amyloid precursor protein at node of Ranvier modulates nodal formation

, , , , , , , , & show all
Pages 396-403 | Received 11 Feb 2014, Accepted 07 Apr 2014, Published online: 20 Dec 2014

Figures & data

Figure 1. APP localizes at nodes of Ranvier in the CNS, but not in the PNS. (A and B) The longitudinal sections of spinal cord of 2-mo-old rat were stained for APP (A and B) and Kvβ2 (A) or tenascin-R (TnR; B). The Z-stack confocal images were showed in the right panels. Scale bars: 10 μm. (C) The longitudinal sections of optic nerves and cerebellum of 2-mo-old rat were stained for APP and tenascin-R (TnR). Scale bar: 20 μm. (D) The teased sciatic nerve were stained for APP and neurofilament200 (NF200) or Kv1.2. Scale bars: 10 μm.
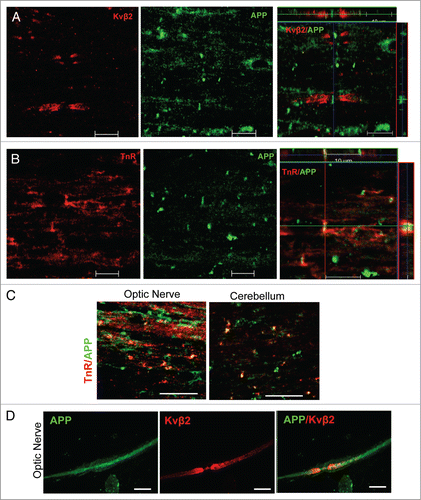
Figure 1. APP localizes at nodes of Ranvier in the CNS, but not in the PNS. (A and B) The longitudinal sections of spinal cord of 2-mo-old rat were stained for APP (A and B) and Kvβ2 (A) or tenascin-R (TnR; B). The Z-stack confocal images were showed in the right panels. Scale bars: 10 μm. (C) The longitudinal sections of optic nerves and cerebellum of 2-mo-old rat were stained for APP and tenascin-R (TnR). Scale bar: 20 μm. (D) The teased sciatic nerve were stained for APP and neurofilament200 (NF200) or Kv1.2. Scale bars: 10 μm.

Figure 2. Location of APP in the spinal cord during development. (A) The longitudinal sections of spinal cord of rats at postnatal day 6 (P6), P10, P15, and P21 were stained for APP and sodium channel (Pan; P6) or Kv1.2 (Kch; P10, 15, and P21). Scale bars: 10 μm. (B) The numbers of APP+ nodes were quantified and expressed as the percentage of APP+ nodes and Kch+-defined gaps. Data are presented as mean ± SEM.
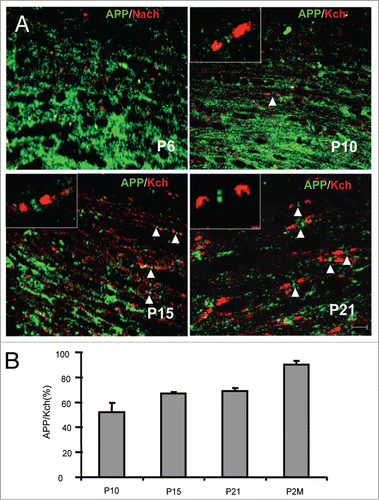
Figure 2. Location of APP in the spinal cord during development. (A) The longitudinal sections of spinal cord of rats at postnatal day 6 (P6), P10, P15, and P21 were stained for APP and sodium channel (Pan; P6) or Kv1.2 (Kch; P10, 15, and P21). Scale bars: 10 μm. (B) The numbers of APP+ nodes were quantified and expressed as the percentage of APP+ nodes and Kch+-defined gaps. Data are presented as mean ± SEM.

Figure 3. Increased nodal length in APP KO spinal cord. (A) The longitudinal sections of spinal cord from APP- KO and WT mice at 2 mo old were stained for Caspr and sodium chanels (Nach). Scale bars: 10 μm. Scale bars in higher magnification: 5 μm. (B) Nodal lengths in APP KO vs. WT mice were analyzed. The nodal length in APP WT spinal cord was normalized to 1.0. The relative nodal length in APP KO spinal cord was quantified and compared. Data are presented as mean ± SEM. *P < 0.05. (C and D) EM analyses of longitudinal spinal cord sections of APP KO vs. WT mice (all aged 3 mo). The red dotted lines and bars mark the spans of nodal gaps. Scale bars: 500 nm. The nodal length in APP WT spinal cord was normalized to 100. The relative nodal length in APP KO spinal cord was quantified and compared. Data are presented as mean ± SEM. *P < 0.05.
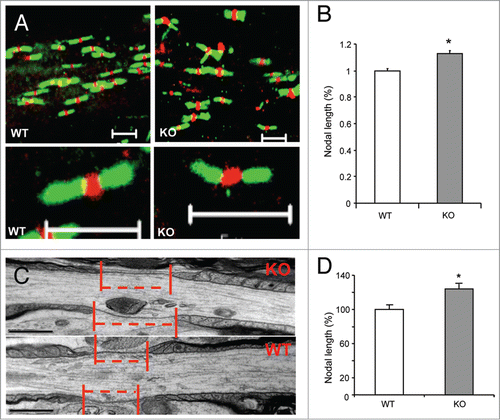
Figure 3. Increased nodal length in APP KO spinal cord. (A) The longitudinal sections of spinal cord from APP- KO and WT mice at 2 mo old were stained for Caspr and sodium chanels (Nach). Scale bars: 10 μm. Scale bars in higher magnification: 5 μm. (B) Nodal lengths in APP KO vs. WT mice were analyzed. The nodal length in APP WT spinal cord was normalized to 1.0. The relative nodal length in APP KO spinal cord was quantified and compared. Data are presented as mean ± SEM. *P < 0.05. (C and D) EM analyses of longitudinal spinal cord sections of APP KO vs. WT mice (all aged 3 mo). The red dotted lines and bars mark the spans of nodal gaps. Scale bars: 500 nm. The nodal length in APP WT spinal cord was normalized to 100. The relative nodal length in APP KO spinal cord was quantified and compared. Data are presented as mean ± SEM. *P < 0.05.

Figure 4. The effects of APP on myelination. (A) EM studies of cross-sections revealed the ultrastructure of myelin sheaths in spinal cords (SC) of WT vs. APP KO mice (all aged 3 mo). Scale bars: 2 μm. (B) The g ratio in APP WT and KO spinal cord was analyzed. Data are presented as mean ± SEM. **P < 0.01. (C) The g ratio in APP WT spinal cord was normalized as 100%. The relative g ratio in APP KO spinal cord was shown. (D) EM studies of cross-sections revealed the ultrastructure of myelin sheaths in the spinal cord (SC) of WT littermates vs. APP TG mice (all aged 3 mo). Scale bars: 2 μm. (E) The g ratio in APP WT and TG spinal cord was analyzed. Data are presented as mean ± SEM. **P < 0.01. (F) The g ratio in APP WT spinal cord was normalized as 100%. The relative g ratio in APP TG spinal cord was shown. (G) EM studies of cross-sections revealed the ultrastructure of myelin sheaths in sciatic nerves (SN) of APP WT and KO mice (all aged 3 mo). Scale bars: 5 μm. (H) The g ratio in the sciatic nerve of APP WT and KO at 3 mo old was analyzed. Data are presented as mean ± SEM. **P < 0.01. (I) The g ratio in APP WT sciatic nerve was normalized as 100%. The relative g ratio in APP KO sciatic nerve was shown.
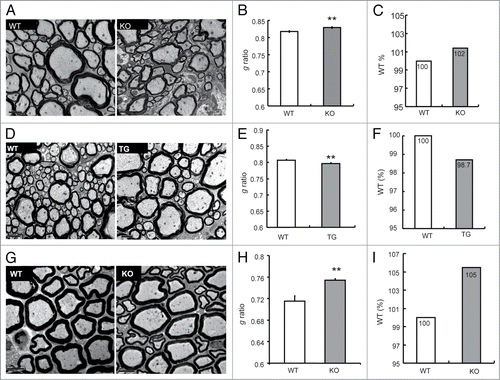
Figure 4. The effects of APP on myelination. (A) EM studies of cross-sections revealed the ultrastructure of myelin sheaths in spinal cords (SC) of WT vs. APP KO mice (all aged 3 mo). Scale bars: 2 μm. (B) The g ratio in APP WT and KO spinal cord was analyzed. Data are presented as mean ± SEM. **P < 0.01. (C) The g ratio in APP WT spinal cord was normalized as 100%. The relative g ratio in APP KO spinal cord was shown. (D) EM studies of cross-sections revealed the ultrastructure of myelin sheaths in the spinal cord (SC) of WT littermates vs. APP TG mice (all aged 3 mo). Scale bars: 2 μm. (E) The g ratio in APP WT and TG spinal cord was analyzed. Data are presented as mean ± SEM. **P < 0.01. (F) The g ratio in APP WT spinal cord was normalized as 100%. The relative g ratio in APP TG spinal cord was shown. (G) EM studies of cross-sections revealed the ultrastructure of myelin sheaths in sciatic nerves (SN) of APP WT and KO mice (all aged 3 mo). Scale bars: 5 μm. (H) The g ratio in the sciatic nerve of APP WT and KO at 3 mo old was analyzed. Data are presented as mean ± SEM. **P < 0.01. (I) The g ratio in APP WT sciatic nerve was normalized as 100%. The relative g ratio in APP KO sciatic nerve was shown.
Supplemental material

2014CAM0015R-Sup.pdf

Download PDF (100.4 KB)

Reprints and Corporate Permissions

Please note: Selecting permissions does not provide access to the full text of the article, please see our help page How do I view content?

To request a reprint or corporate permissions for this article, please click on the relevant link below:

Academic Permissions

Please note: Selecting permissions does not provide access to the full text of the article, please see our help page How do I view content?

Obtain permissions instantly via Rightslink by clicking on the button below:

If you are unable to obtain permissions via Rightslink, please complete and submit this Permissions form. For more information, please visit our Permissions help page.