1,465
Views
19
CrossRef citations to date
0
Altmetric
Research Paper

EDI3 links choline metabolism to integrin expression, cell adhesion and spreading

, , , , &
Pages 499-508 | Received 19 Mar 2014, Accepted 20 May 2014, Published online: 31 Oct 2014

Figures & data

Table 1. Gene array results: Altered genes involved in attachment and migration

Table 2. Gene ontology (GO) analysis after EDI3 knockdown

Figure 1. siRNA knockdown of EDI3 induces gene expression alterations important for adhesion and migration. (A) Quantitative real-time PCR, western blot analyses and spectrophotometric EDI3 activity assays using total cell lysates obtained from MCF-7 cells treated with control or specific EDI3 siRNA revealed a knockdown efficiency of approximately 80%. (B) Heatmap analysis comparing EDI3 siRNA knockdown (left side of map, numbered below as 4–6, 10–12, 16–18) in MCF-7 cells to controls transfected with non-targeting siRNA (right side of map, numbered below as 1–3, 7–9, 13–15). The color within the heat map represents the raw normalized gene expression data from the Affymetrix chip as described in the color key. The 100 most differentially expressed genes with a fold change of 1.5 and an adjusted P < 0.05 (EDI3 siRNA vs. control siRNA) were used to generate the heat map. The genes listed on the right are provided in Table S1, together with expression values. (C) Volcano plot showing the log2-fold change and p value of differentially expressed genes (EDI3 siRNA vs. control siRNA) in the Cancer Pathway Finder PCR array (SABiosciences). The black vertical line represents a fold change of one; whereas, the two pink lines represent a fold change of 1.5. The horizontal blue line represents the threshold of the p value which is set for P = 0.05. Three independent biological replicates were run as described in the methods section.
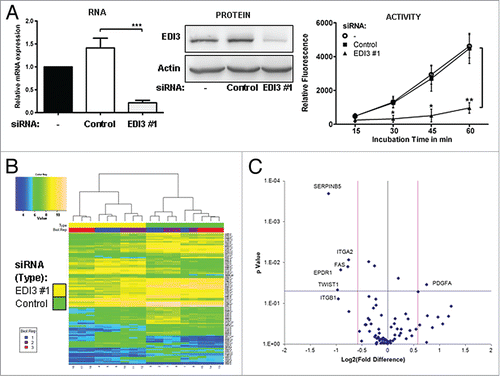
Figure 1. siRNA knockdown of EDI3 induces gene expression alterations important for adhesion and migration. (A) Quantitative real-time PCR, western blot analyses and spectrophotometric EDI3 activity assays using total cell lysates obtained from MCF-7 cells treated with control or specific EDI3 siRNA revealed a knockdown efficiency of approximately 80%. (B) Heatmap analysis comparing EDI3 siRNA knockdown (left side of map, numbered below as 4–6, 10–12, 16–18) in MCF-7 cells to controls transfected with non-targeting siRNA (right side of map, numbered below as 1–3, 7–9, 13–15). The color within the heat map represents the raw normalized gene expression data from the Affymetrix chip as described in the color key. The 100 most differentially expressed genes with a fold change of 1.5 and an adjusted P < 0.05 (EDI3 siRNA vs. control siRNA) were used to generate the heat map. The genes listed on the right are provided in Table S1, together with expression values. (C) Volcano plot showing the log2-fold change and p value of differentially expressed genes (EDI3 siRNA vs. control siRNA) in the Cancer Pathway Finder PCR array (SABiosciences). The black vertical line represents a fold change of one; whereas, the two pink lines represent a fold change of 1.5. The horizontal blue line represents the threshold of the p value which is set for P = 0.05. Three independent biological replicates were run as described in the methods section.

Table 3. Top genes found to be altered by PCR Array analysis

Figure 2. Downregulation of EDI3 reduces expression levels of integrin β1 and integrin α5. (A) Transfections of control siRNA and two EDI3-specific siRNAs were performed in five different cancer cell lines, namely OVCAR-3 (ovarian cancer), MCF-7 and T47D (both breast cancer), AN3-CA and MFE-296 (both endometrial cancer). RNA expression levels of EDI3, integrin β1 and integrin α5 were analyzed using quantitative real-time PCR. Values in graphs represent the mean ± SD from five independent experiments. (B) Cells were treated as described in (A) and protein expression levels of EDI3, integrin β1 and integrin α5 were analyzed by western blotting. Actin, α-tubulin and calnexin were used as loading controls. Shown are representative images and quantification values represent mean ± SD from three independent experiments.
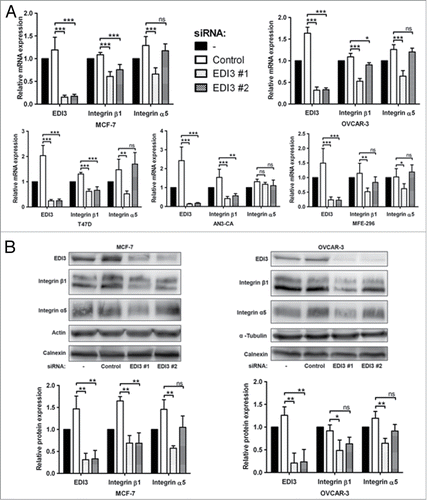
Figure 2. Downregulation of EDI3 reduces expression levels of integrin β1 and integrin α5. (A) Transfections of control siRNA and two EDI3-specific siRNAs were performed in five different cancer cell lines, namely OVCAR-3 (ovarian cancer), MCF-7 and T47D (both breast cancer), AN3-CA and MFE-296 (both endometrial cancer). RNA expression levels of EDI3, integrin β1 and integrin α5 were analyzed using quantitative real-time PCR. Values in graphs represent the mean ± SD from five independent experiments. (B) Cells were treated as described in (A) and protein expression levels of EDI3, integrin β1 and integrin α5 were analyzed by western blotting. Actin, α-tubulin and calnexin were used as loading controls. Shown are representative images and quantification values represent mean ± SD from three independent experiments.

Figure 3. Downregulation of EDI3 impairs initial cell adhesion on fibronectin (FN). After siRNA knockdown for 72 h, (A) MCF-7 human breast cancer cells and (B) OVCAR-3 human ovarian cancer cells were harvested in suspension media containing 1% FBS and 0.5 mg/ml trypsin inhibitor, maintained in suspension for 1 h, and then re-plated on FN-coated 24-well plates for 30 or 60 min. Adherent cells were fixed and stained with crystal violet. Shown are representative phase contrast images taken with a 10x objective. Bars: 100 μm. After de-staining, the released crystal violet was quantified by absorbance measurements. Values in graphs represent mean ± SD from three independent experiments.
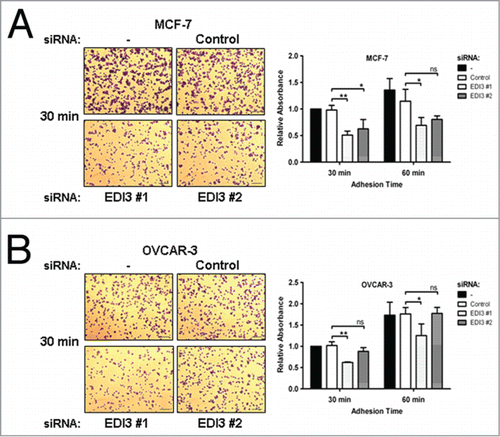
Figure 3. Downregulation of EDI3 impairs initial cell adhesion on fibronectin (FN). After siRNA knockdown for 72 h, (A) MCF-7 human breast cancer cells and (B) OVCAR-3 human ovarian cancer cells were harvested in suspension media containing 1% FBS and 0.5 mg/ml trypsin inhibitor, maintained in suspension for 1 h, and then re-plated on FN-coated 24-well plates for 30 or 60 min. Adherent cells were fixed and stained with crystal violet. Shown are representative phase contrast images taken with a 10x objective. Bars: 100 μm. After de-staining, the released crystal violet was quantified by absorbance measurements. Values in graphs represent mean ± SD from three independent experiments.

Figure 4. Downregulation of EDI3 impairs cell spreading. After siRNA knockdown of EDI3 for 72 h, (A) MCF-7 cells and (B) OVCAR-3 cells were harvested and maintained in suspension for 1 h, and then re-plated on FN-coated 24-well plates for 60 min. Adherent cells were fixed with 4% paraformaldehyde and phase contrast images of unstained cells were taken with a 20x objective. Bars: 50 μm. Magnified views are shown in the inserts. The cell area of 100 randomly chosen cells per condition and experiment from four independent experiments was quantified using ImageJ software and the mean cell size ± SD was calculated. Each point corresponds to the measured area of an individual cell. (C) SiRNA-treated MCF-7 and OVCAR-3 cells were harvested as described before and re-plated on FN-coated coverslips for 60 min. Adherent cells were fixed with 4% paraformaldehyde, and stained with phalloidin Alexa-488 (green) and DAPI (blue). Shown are representative single-cell images taken with a confocal laser scanning microscope using a 60x objective. Bars: 10 μm.
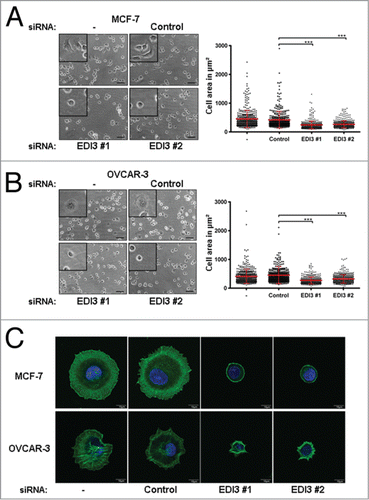
Figure 4. Downregulation of EDI3 impairs cell spreading. After siRNA knockdown of EDI3 for 72 h, (A) MCF-7 cells and (B) OVCAR-3 cells were harvested and maintained in suspension for 1 h, and then re-plated on FN-coated 24-well plates for 60 min. Adherent cells were fixed with 4% paraformaldehyde and phase contrast images of unstained cells were taken with a 20x objective. Bars: 50 μm. Magnified views are shown in the inserts. The cell area of 100 randomly chosen cells per condition and experiment from four independent experiments was quantified using ImageJ software and the mean cell size ± SD was calculated. Each point corresponds to the measured area of an individual cell. (C) SiRNA-treated MCF-7 and OVCAR-3 cells were harvested as described before and re-plated on FN-coated coverslips for 60 min. Adherent cells were fixed with 4% paraformaldehyde, and stained with phalloidin Alexa-488 (green) and DAPI (blue). Shown are representative single-cell images taken with a confocal laser scanning microscope using a 60x objective. Bars: 10 μm.

Figure 5. EDI3 overexpression leads to increased integrin α5β1 expression promoting both initial attachment and spreading. (A) In MCF-7 cells stably overexpressing EDI3, both RNA and protein expression levels of EDI3, integrin β1 and integrin α5 were analyzed using quantitative real-time PCR (n = 5) and western blotting (n = 3), respectively. For phenotypic analyses, the same cells were harvested and maintained in suspension for 1 h, and then re-plated on FN-coated culture dishes. (B) To analyze adhesion, cells were fixed and stained with crystal violet after 10, 30 and 60 min, and quantification was performed by absorbance measurements (n = 4). Bars: 100 μm. (C) To analyze spreading, cells were fixed with 4% paraformaldehyde after 30 min, and cell area was quantified based on phase contrast images (n = 4). The mean cell size ± SD was calculated from a total number of 400 randomly chosen cells gained from four independent experiments. Each point corresponds to the measured area of an individual cell. Bars: 50 μm. (D) To visualize the actin cytoskeleton, cells were fixed with 4% paraformaldehyde after 30 min, and stained with rhodamine phalloidin (green) and DAPI (blue) (n = 3). Bars: 10 μm. All images shown are representative and the values in graphs represent the mean ± SD of at least three independent experiments.
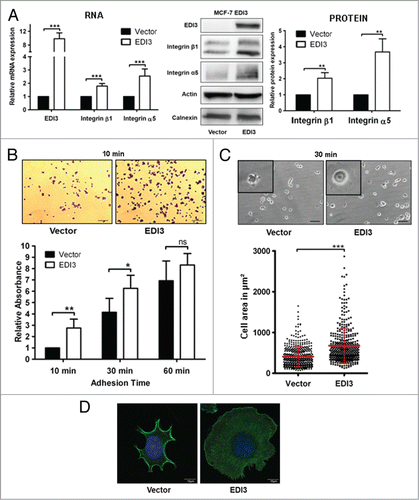
Figure 5. EDI3 overexpression leads to increased integrin α5β1 expression promoting both initial attachment and spreading. (A) In MCF-7 cells stably overexpressing EDI3, both RNA and protein expression levels of EDI3, integrin β1 and integrin α5 were analyzed using quantitative real-time PCR (n = 5) and western blotting (n = 3), respectively. For phenotypic analyses, the same cells were harvested and maintained in suspension for 1 h, and then re-plated on FN-coated culture dishes. (B) To analyze adhesion, cells were fixed and stained with crystal violet after 10, 30 and 60 min, and quantification was performed by absorbance measurements (n = 4). Bars: 100 μm. (C) To analyze spreading, cells were fixed with 4% paraformaldehyde after 30 min, and cell area was quantified based on phase contrast images (n = 4). The mean cell size ± SD was calculated from a total number of 400 randomly chosen cells gained from four independent experiments. Each point corresponds to the measured area of an individual cell. Bars: 50 μm. (D) To visualize the actin cytoskeleton, cells were fixed with 4% paraformaldehyde after 30 min, and stained with rhodamine phalloidin (green) and DAPI (blue) (n = 3). Bars: 10 μm. All images shown are representative and the values in graphs represent the mean ± SD of at least three independent experiments.
Supplemental material

Supplemental_Files.zip

Download Zip (836.1 KB)