741
Views
17
CrossRef citations to date
0
Altmetric
Research Paper

Functional role of laminin α1 chain during cerebellum development

, , , , , & show all
Pages 480-489 | Received 15 Dec 2011, Accepted 28 Dec 2011, Published online: 01 Nov 2011

Figures & data

Figure 1 Abnormal cerebellar organization in adult Lama1cko animals. Macroscopic observation of whole cerebella (A and B) reveals a reduced size of Lama1cko adult cerebellum compare with control. Histological examination of coronal sections of adult control (C) and Lama1cko (D) cerebella stained with cresyl violet demonstrates abnormal foliation and global perturbation of cerebellar layers (E and F). Black arrow heads are pointing out the limits between folia in control mice (C). White arrows are pointing out islets of ectopic cells abnormally located in the outer part of the molecular layer of Lama1cko (F). Scale bars: 1 mm (A), 100 µm (C–F). ML, Molecular Layer; IGL, Internal Granular Layer.
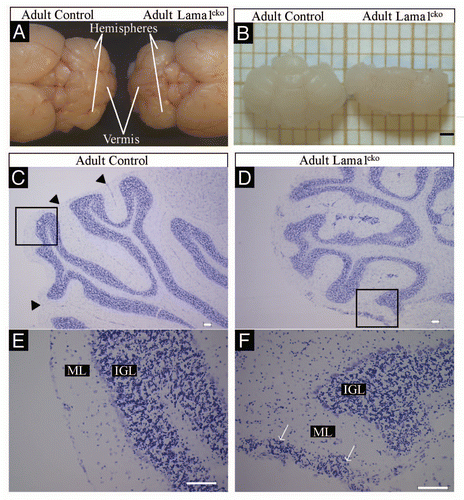
Figure 1 Abnormal cerebellar organization in adult Lama1cko animals. Macroscopic observation of whole cerebella (A and B) reveals a reduced size of Lama1cko adult cerebellum compare with control. Histological examination of coronal sections of adult control (C) and Lama1cko (D) cerebella stained with cresyl violet demonstrates abnormal foliation and global perturbation of cerebellar layers (E and F). Black arrow heads are pointing out the limits between folia in control mice (C). White arrows are pointing out islets of ectopic cells abnormally located in the outer part of the molecular layer of Lama1cko (F). Scale bars: 1 mm (A), 100 µm (C–F). ML, Molecular Layer; IGL, Internal Granular Layer.

Figure 2 Basement membrane alteration in P7 Lama1cko animals. Coronal sections of P7 control (A, C, E and G) and Lama1cko (B, D, F and H) cerebella stained with cresyl violet (A and B), laminin α1 antibody (C and D), pan-laminin antibody (E and F) and Type IV collagen (G and H). Scale bar: 100 µm. EGL, External Granular Layer; IGL, Internal Granular Layer.
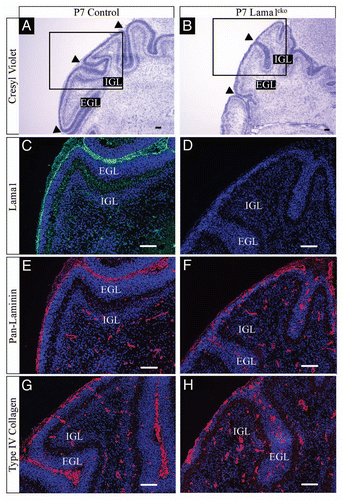
Figure 2 Basement membrane alteration in P7 Lama1cko animals. Coronal sections of P7 control (A, C, E and G) and Lama1cko (B, D, F and H) cerebella stained with cresyl violet (A and B), laminin α1 antibody (C and D), pan-laminin antibody (E and F) and Type IV collagen (G and H). Scale bar: 100 µm. EGL, External Granular Layer; IGL, Internal Granular Layer.

Figure 3 Basement membrane alteration in P20 Lama1cko animals. Coronal sections of P20 control (A, C, E and G) and Lama1cko (B, D, F and H) cerebella stained with cresyl violet (A and B), laminin α1 antibody (C and D), pan-laminin antibody (E and F) and Type IV collagen (G and H). Scale bar: 100 µm. ML, Molecular Layer; IGL, Internal Granular Layer.
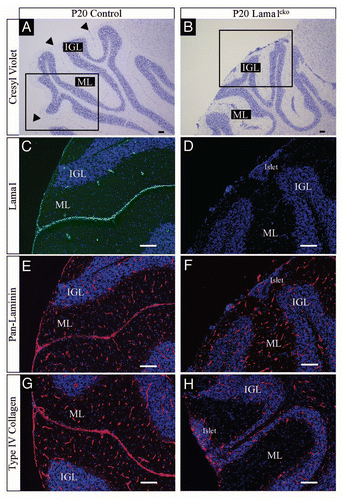
Figure 3 Basement membrane alteration in P20 Lama1cko animals. Coronal sections of P20 control (A, C, E and G) and Lama1cko (B, D, F and H) cerebella stained with cresyl violet (A and B), laminin α1 antibody (C and D), pan-laminin antibody (E and F) and Type IV collagen (G and H). Scale bar: 100 µm. ML, Molecular Layer; IGL, Internal Granular Layer.

Figure 4 Basement membrane alteration in adult Lama1cko animals. Coronal sections of adult control (A, C, E and G) and Lama1cko (B, D, F and H) cerebella stained with laminin α1 antibody (A and B), panlaminin antibody (C and D), Type IV collagen (E and F) and Perlecan (G and H). Scale bar: 100 µm. ML, Molecular Layer; IGL, Internal Granular Layer.
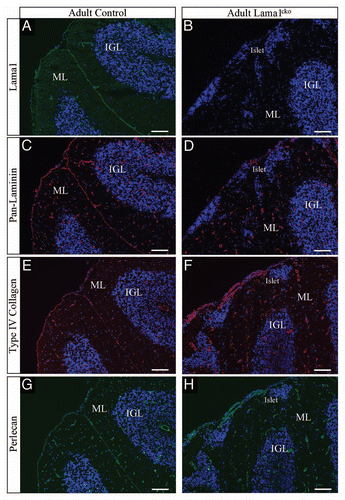
Figure 4 Basement membrane alteration in adult Lama1cko animals. Coronal sections of adult control (A, C, E and G) and Lama1cko (B, D, F and H) cerebella stained with laminin α1 antibody (A and B), panlaminin antibody (C and D), Type IV collagen (E and F) and Perlecan (G and H). Scale bar: 100 µm. ML, Molecular Layer; IGL, Internal Granular Layer.

Figure 5 Increased proliferation (Ki67) of granule cell precursors in P7 Lama1cko animals. Coronal sections of P7 control (A and C) and Lama1cko (B and D) cerebella stained for the proliferation marker Ki67 and counterstained with DAPI. Camera lucida drawing highlights the localization of Ki67 positive cells (E and F). The dashed line in the EGL of control animals (E) represents the limit between the outer and inner part of this layer. (G) Quantification of Ki67 positive cells (**p < 0.01). Scale bar: 100 µm. EGL, External Granular Layer; IGL, Internal Granular Layer.
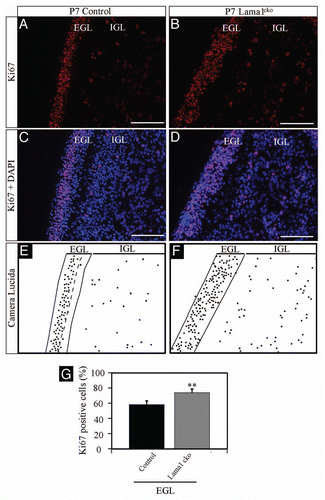
Figure 5 Increased proliferation (Ki67) of granule cell precursors in P7 Lama1cko animals. Coronal sections of P7 control (A and C) and Lama1cko (B and D) cerebella stained for the proliferation marker Ki67 and counterstained with DAPI. Camera lucida drawing highlights the localization of Ki67 positive cells (E and F). The dashed line in the EGL of control animals (E) represents the limit between the outer and inner part of this layer. (G) Quantification of Ki67 positive cells (**p < 0.01). Scale bar: 100 µm. EGL, External Granular Layer; IGL, Internal Granular Layer.
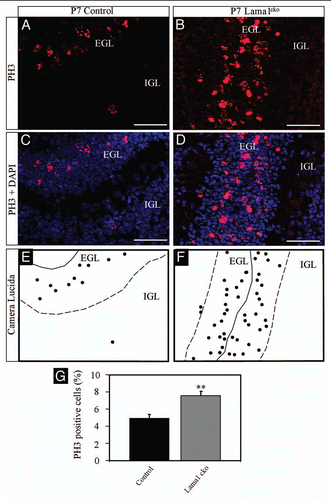
Figure 6 Increased proliferation of granule cell precursors in P7 Lama1cko animals (PH3). Coronal sections of P7 control (A and C) and Lama1cko (B and D) cerebella stained for the proliferation marker PH3 and counterstained with DAPI. Camera lucida drawing highlights the localization of PH3 positive cells (E and F). The dashed line represents the limit between the EGL and IGL. (G) Quantification of PH3 positive cells (**p < 0.01). Scale bar: 100 µm. EGL, External Granular Layer; IGL, Internal Granular Layer.

Figure 6 Increased proliferation of granule cell precursors in P7 Lama1cko animals (PH3). Coronal sections of P7 control (A and C) and Lama1cko (B and D) cerebella stained for the proliferation marker PH3 and counterstained with DAPI. Camera lucida drawing highlights the localization of PH3 positive cells (E and F). The dashed line represents the limit between the EGL and IGL. (G) Quantification of PH3 positive cells (**p < 0.01). Scale bar: 100 µm. EGL, External Granular Layer; IGL, Internal Granular Layer.

Figure 7 Persistence of Ki67-positive cells in the ML of P20 Lama1cko animals. Coronal sections of P20 control (A and C) and Lama1cko (B and D) cerebella stained for the proliferation marker Ki67 and counterstained with DAPI. Camera lucida drawing highlights the localization of Ki67 positive cells (E and F). The dashed line represents the limit between the ML and IGL. Scale bar: 100 µm. ML, Molecular Layer; IGL, Internal Granular Layer.
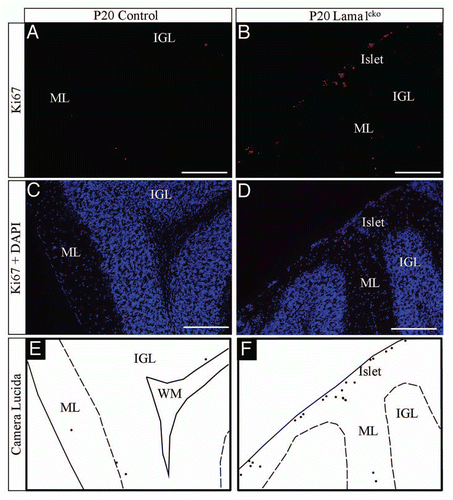
Figure 7 Persistence of Ki67-positive cells in the ML of P20 Lama1cko animals. Coronal sections of P20 control (A and C) and Lama1cko (B and D) cerebella stained for the proliferation marker Ki67 and counterstained with DAPI. Camera lucida drawing highlights the localization of Ki67 positive cells (E and F). The dashed line represents the limit between the ML and IGL. Scale bar: 100 µm. ML, Molecular Layer; IGL, Internal Granular Layer.

Figure 8 Decreased survival of GC in P20 Lama1cko animals. Coronal sections of P20 control (A) and Lama1cko (B) cerebella stained with BrdU antibody to reveal number of surviving postmitotic P7-BrdU labeled GC. (C) Quantification of BrdU positive cells in the IGL. In spite of increased proliferation at P7 in Lama1cko mice (leading to increased BrdU uptake) a similar number of BrdU positive cells is quantified in both genotypes at P20 thereby suggesting decreased survival of GC in Lama1cko mice. Scale bar = 100 µm. ML, Molecular Layer, IGL, Internal Granular Layer
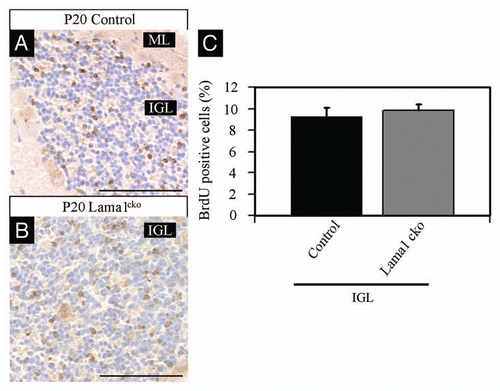
Figure 8 Decreased survival of GC in P20 Lama1cko animals. Coronal sections of P20 control (A) and Lama1cko (B) cerebella stained with BrdU antibody to reveal number of surviving postmitotic P7-BrdU labeled GC. (C) Quantification of BrdU positive cells in the IGL. In spite of increased proliferation at P7 in Lama1cko mice (leading to increased BrdU uptake) a similar number of BrdU positive cells is quantified in both genotypes at P20 thereby suggesting decreased survival of GC in Lama1cko mice. Scale bar = 100 µm. ML, Molecular Layer, IGL, Internal Granular Layer

Figure 9 Increased apoptosis in P20 Lama1cko animals. Coronal sections of P20 control (A) and Lama1cko (B) cerebella stained with cleaved caspase-3 antibody to reveal apoptotic cells. (C) Quantification of caspase-3 positive cells in the IGL (**p < 0.01). Scale bar: 100 µm. ML, Molecular Layer; IGL, Internal Granular Layer.
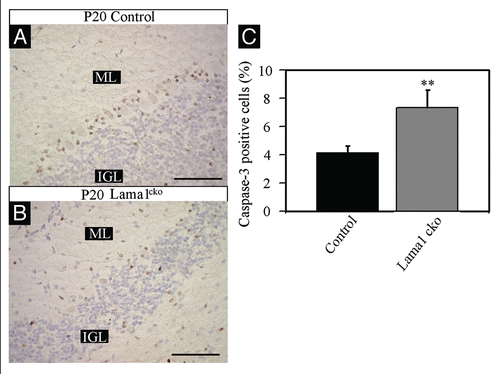
Figure 9 Increased apoptosis in P20 Lama1cko animals. Coronal sections of P20 control (A) and Lama1cko (B) cerebella stained with cleaved caspase-3 antibody to reveal apoptotic cells. (C) Quantification of caspase-3 positive cells in the IGL (**p < 0.01). Scale bar: 100 µm. ML, Molecular Layer; IGL, Internal Granular Layer.

Figure 10 Abnormal Bergmann glia network in P20 Lama1cko animals. Coronal sections of P20 control (A, C and E) and Lama1cko (B, D and F) cerebella stained with DAPI to reveal cellular organization (A and B), GFAP antibody to reveal glial fibers (green color) and pan-laminin antibody to reveal the basement membrane (red color) (C–F). Scale bar: 100 µm. ML, Molecular Layer; IGL, Internal Granular Layer.
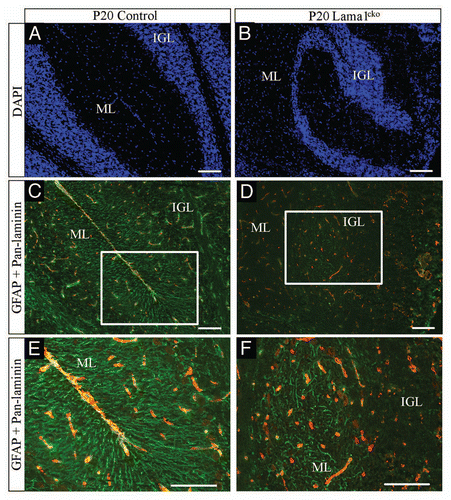
Figure 10 Abnormal Bergmann glia network in P20 Lama1cko animals. Coronal sections of P20 control (A, C and E) and Lama1cko (B, D and F) cerebella stained with DAPI to reveal cellular organization (A and B), GFAP antibody to reveal glial fibers (green color) and pan-laminin antibody to reveal the basement membrane (red color) (C–F). Scale bar: 100 µm. ML, Molecular Layer; IGL, Internal Granular Layer.