551
Views
8
CrossRef citations to date
0
Altmetric
Research Paper

Radioimmunotherapy with an antibody to the HPV16 E6 oncoprotein is effective in an experimental cervical tumor expressing low levels of E6

, , , , , , & show all
Pages 1041-1047 | Published online: 15 Nov 2010

Figures & data

Figure 1 Diagram illustrating the mechanism of cervical cancer RIT with radiolabeled E6 or E7-binding mAbs. E6 and E7 proteins become accessible to mAbs in the non-viable cells and in the interstitial space as a consequence of cellular turnover in a fast-growing tumor. The mAbs bind to accessible E6 and E7 and deliver cytotoxic radiation to the tumor. Viable cancer cells are killed by radiation penetrating several cells diameters (so called “cross-fire” effect). CC, cervical cancer.
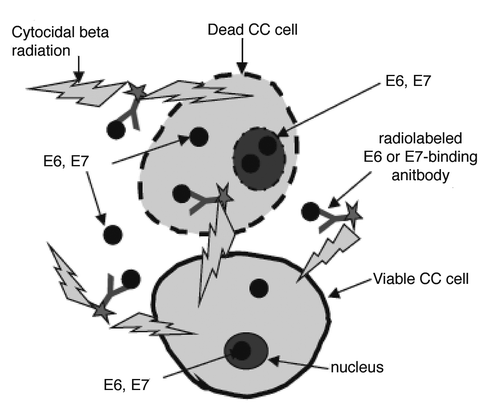
Figure 1 Diagram illustrating the mechanism of cervical cancer RIT with radiolabeled E6 or E7-binding mAbs. E6 and E7 proteins become accessible to mAbs in the non-viable cells and in the interstitial space as a consequence of cellular turnover in a fast-growing tumor. The mAbs bind to accessible E6 and E7 and deliver cytotoxic radiation to the tumor. Viable cancer cells are killed by radiation penetrating several cells diameters (so called “cross-fire” effect). CC, cervical cancer.

Figure 2 Western blot of cervical tumor cell lysates showing E6 and E7 expression: (A) E6 and E7 in tumor tissues from 4 patients with metastatic cervical cancer. P1–P4, Patients 1–4; (B) E6 in CasKi tumor (line 1) and in patient tumor (line 2); (C) E6 in patient tumor (line 1) and in SiHa tumor (line 2).
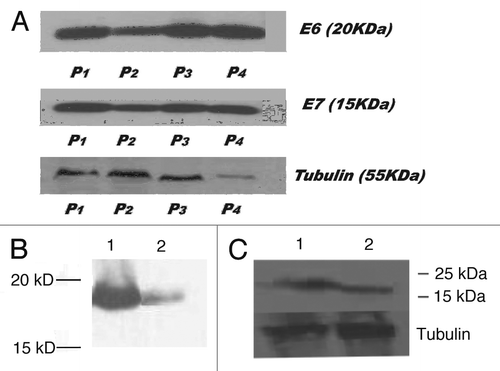
Figure 2 Western blot of cervical tumor cell lysates showing E6 and E7 expression: (A) E6 and E7 in tumor tissues from 4 patients with metastatic cervical cancer. P1–P4, Patients 1–4; (B) E6 in CasKi tumor (line 1) and in patient tumor (line 2); (C) E6 in patient tumor (line 1) and in SiHa tumor (line 2).

Figure 3 Influence of proteasome inhibitor MG132 on the levels of E6 in SiHa cells in vitro and in vivo: (A) SiHa cells in vitro treated with 0, 5, 10 and 25 µg/ml MG132 (lines 1–4, respectively) for 3 hrs; (B) SiHa tumors from nude mice. Tumor in line 1 is from a mouse treated with 20 µg MG132 with tumor being removed 3 hrs after is from the control mouse treatment; tumor in line 2 is from the control untreated mouse.
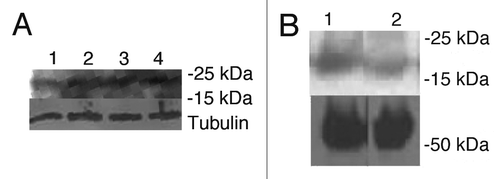
Figure 3 Influence of proteasome inhibitor MG132 on the levels of E6 in SiHa cells in vitro and in vivo: (A) SiHa cells in vitro treated with 0, 5, 10 and 25 µg/ml MG132 (lines 1–4, respectively) for 3 hrs; (B) SiHa tumors from nude mice. Tumor in line 1 is from a mouse treated with 20 µg MG132 with tumor being removed 3 hrs after is from the control mouse treatment; tumor in line 2 is from the control untreated mouse.

Figure 4 Tumor size in SiHa tumor-bearing mice treated with: 200 µCi 188Re-C1P5 mAb; matching amount (6 µg) of “cold” C1P5 mAb; 20 µg MG-132 followed by 200 µCi 188Re-C1P5 mAb 3 hr later; 20 µg MG-132; 200 µCi 188Re-18B7 control mAb; or left untreated. On day 12 one mouse in control group was sacrificed because tumor diameter exceeded 1 cm. To, tumor diameter on the day of treatment; Tn, tumor diameter on the day of measurement.
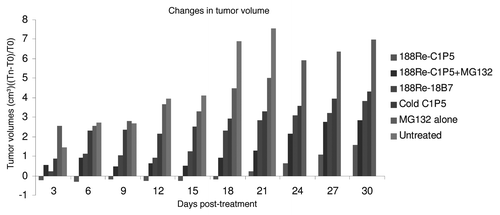
Figure 4 Tumor size in SiHa tumor-bearing mice treated with: 200 µCi 188Re-C1P5 mAb; matching amount (6 µg) of “cold” C1P5 mAb; 20 µg MG-132 followed by 200 µCi 188Re-C1P5 mAb 3 hr later; 20 µg MG-132; 200 µCi 188Re-18B7 control mAb; or left untreated. On day 12 one mouse in control group was sacrificed because tumor diameter exceeded 1 cm. To, tumor diameter on the day of treatment; Tn, tumor diameter on the day of measurement.

Figure 5 H&E histology of SiHa tumors from the following treatment groups in the RIT experiment: (A) 200 µCi 188Re-C1P5 mAb; (B) 20 µg MG-132 followed by 200 µCi 188Re-C1P5 mAb 3 hr later; (C) untreated; (D) “cold” C1P5 mAb; (E) 20 µg MG-132; (F) 200 µCi 188Re-18B7 control mAb. Original magnification ×100.
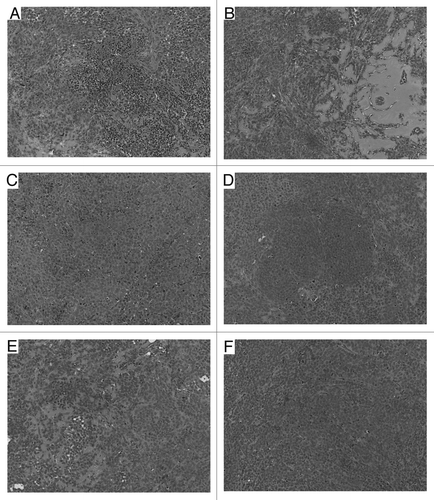
Figure 5 H&E histology of SiHa tumors from the following treatment groups in the RIT experiment: (A) 200 µCi 188Re-C1P5 mAb; (B) 20 µg MG-132 followed by 200 µCi 188Re-C1P5 mAb 3 hr later; (C) untreated; (D) “cold” C1P5 mAb; (E) 20 µg MG-132; (F) 200 µCi 188Re-18B7 control mAb. Original magnification ×100.

Table 1 p values for comparison of tumor sizes in E6-specific treatment groups 188Re-C1P5 mAb alone and in MG132 plus 188Re-C1P5 mAb to control groups in RIT experiment

Reprints and Corporate Permissions

Please note: Selecting permissions does not provide access to the full text of the article, please see our help page How do I view content?

To request a reprint or corporate permissions for this article, please click on the relevant link below:

Academic Permissions

Please note: Selecting permissions does not provide access to the full text of the article, please see our help page How do I view content?

Obtain permissions instantly via Rightslink by clicking on the button below:

If you are unable to obtain permissions via Rightslink, please complete and submit this Permissions form. For more information, please visit our Permissions help page.