1,292
Views
60
CrossRef citations to date
0
Altmetric
Research Paper

The role of MNK proteins and eIF4E phosphorylation in breast cancer cell proliferation and survival

, &
Pages 728-735 | Published online: 01 Oct 2010

Figures & data

Figure 1 eIF4E expression and phosphorylation in breast cancer tissue. Equal protein concentrations from 10 breast cancer tissue samples were separated by SDS-PAGE and western blots probed with antibodies to eIF4E and serine 209 phosphorylated eIF4E. Figure representative of two independent blots. Quantitation shows the relative ratios of phosphorylated- to total eIF4E between the samples (*indicates total eIF4E is too low for a reliable analysis).
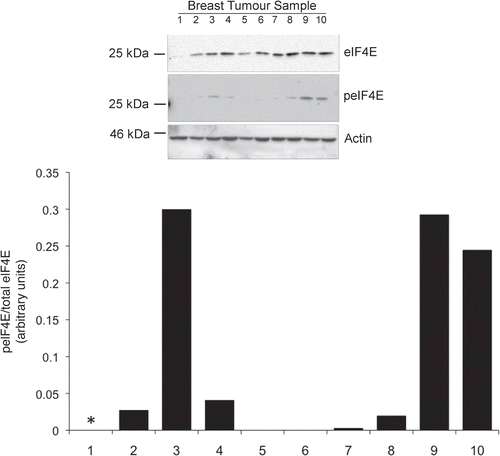
Figure 1 eIF4E expression and phosphorylation in breast cancer tissue. Equal protein concentrations from 10 breast cancer tissue samples were separated by SDS-PAGE and western blots probed with antibodies to eIF4E and serine 209 phosphorylated eIF4E. Figure representative of two independent blots. Quantitation shows the relative ratios of phosphorylated- to total eIF4E between the samples (*indicates total eIF4E is too low for a reliable analysis).

Figure 2 eIF4E expression and phosphorylation in breast cancer tissue. Cells in exponential growth phase were lysed 24 h after the application of fresh medium. Proteins were separated by SDS-PAGE and western blots probed with antibodies to MNK1, eIF4E and serine 209 phosphorylated eIF4E. Figure representative of two independent blots. Quantitation is as per .
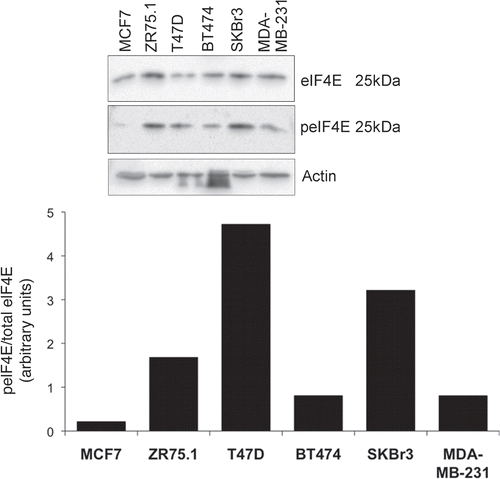
Figure 2 eIF4E expression and phosphorylation in breast cancer tissue. Cells in exponential growth phase were lysed 24 h after the application of fresh medium. Proteins were separated by SDS-PAGE and western blots probed with antibodies to MNK1, eIF4E and serine 209 phosphorylated eIF4E. Figure representative of two independent blots. Quantitation is as per Figure 1.

Figure 3 Dose response analysis of the inhibition of eIF4E phosphorylation by CGP57380. BT474 and SKBr3 cells were treated with the indicated concentrations of CGP57380 for 24 h prior to analysis of cell lysates by western blotting.
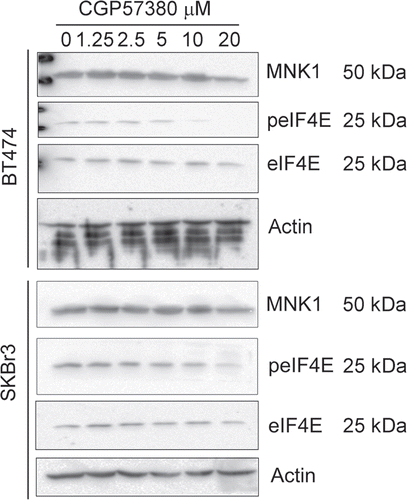
Figure 3 Dose response analysis of the inhibition of eIF4E phosphorylation by CGP57380. BT474 and SKBr3 cells were treated with the indicated concentrations of CGP57380 for 24 h prior to analysis of cell lysates by western blotting.

Figure 4 Time course analysis of the inhibition of eIF4E phosphorylation by CGP57380. Cells were treated with 20 µM CGP57380 for the times as indicated. Proteins were analysed by western blotting. *, cross reacting band.
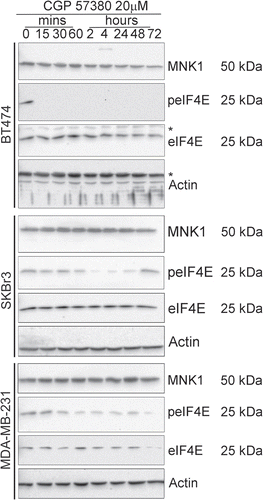
Figure 4 Time course analysis of the inhibition of eIF4E phosphorylation by CGP57380. Cells were treated with 20 µM CGP57380 for the times as indicated. Proteins were analysed by western blotting. *, cross reacting band.

Figure 5 Effects of the MNK inhibitor, CGP57380, on colony formation by breast cancer cell lines. Cells were treated with CGP57380 20 µM or DMSO vehicle control for 24 h before being trypsinised, counted and re-plated at equal number in CGP57380 or DMSO. Colonies were fixed with methanol and stained with Giemsa 9-12 days later. Representative of three replicate plates.
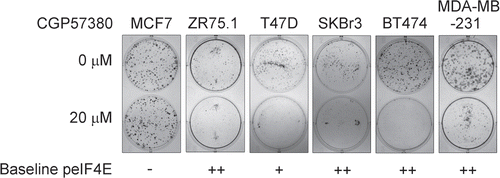
Figure 5 Effects of the MNK inhibitor, CGP57380, on colony formation by breast cancer cell lines. Cells were treated with CGP57380 20 µM or DMSO vehicle control for 24 h before being trypsinised, counted and re-plated at equal number in CGP57380 or DMSO. Colonies were fixed with methanol and stained with Giemsa 9-12 days later. Representative of three replicate plates.

Figure 6 Effects of 72 h exposure to CGP57380 on breast cancer cell line proliferation. Cells for the experiment were plated at a density which resulted in them being in exponential growth phase at the point of assay. Data represents the results from three independent experiments for each cell line. (Bars = mean + SEM, X axis labels represent CGP57380 concentration (µM) 0 = 0.5% DMSO carrier control).
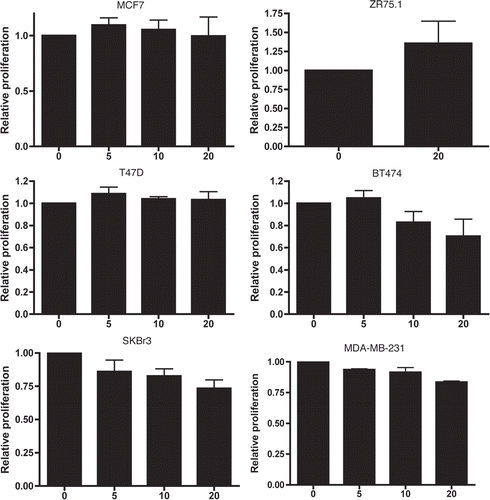
Figure 6 Effects of 72 h exposure to CGP57380 on breast cancer cell line proliferation. Cells for the experiment were plated at a density which resulted in them being in exponential growth phase at the point of assay. Data represents the results from three independent experiments for each cell line. (Bars = mean + SEM, X axis labels represent CGP57380 concentration (µM) 0 = 0.5% DMSO carrier control).

Figure 7 Live cell imaging analysis of CGP57380 treated breast cancer cells. MDA-MB-231 cells and SKBr3 cells were treated with CGP57380 20 µM or DMSO vehicle control before undergoing time lapse photomicroscopy. Graphs show the number of mitotic (black bars) and apoptotic events (white bars) per 100 initial cells during the 24 h imaging period. Results are mean of three experiments + SEM.
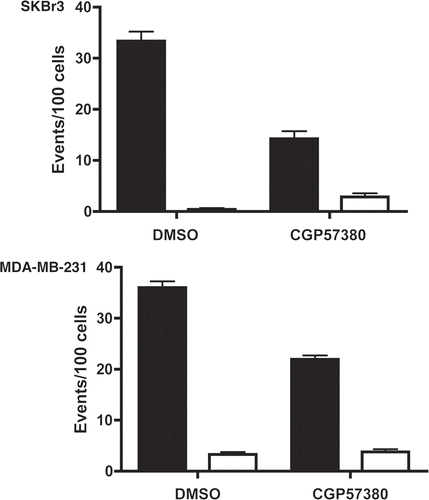
Figure 7 Live cell imaging analysis of CGP57380 treated breast cancer cells. MDA-MB-231 cells and SKBr3 cells were treated with CGP57380 20 µM or DMSO vehicle control before undergoing time lapse photomicroscopy. Graphs show the number of mitotic (black bars) and apoptotic events (white bars) per 100 initial cells during the 24 h imaging period. Results are mean of three experiments + SEM.

Figure 8 Cell cycle analysis of MDA-MB-231 cell line following CGP57380 treatment. MDA-MB-231 cells were treated with CGP57380 20 µM or DMSO (vehicle control); for 24 h prior to analysis of DNA content by propidium iodide staining and flow cytometry. Data shown is the means of three independently repeated experiments, each comprising three replicates. Student's t-test was used for statistical analysis.
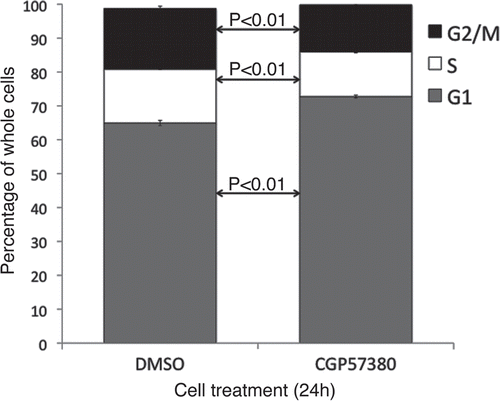
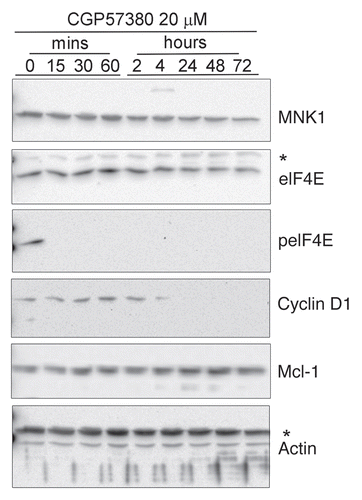
Figure 8 Cell cycle analysis of MDA-MB-231 cell line following CGP57380 treatment. MDA-MB-231 cells were treated with CGP57380 20 µM or DMSO (vehicle control); for 24 h prior to analysis of DNA content by propidium iodide staining and flow cytometry. Data shown is the means of three independently repeated experiments, each comprising three replicates. Student's t-test was used for statistical analysis.

Figure 9 Abundance of MNK-regulated proteins in CGP57380-treated BT474 cells. BT474 cells were treated with CGP57380 for times as indicated. Time 0 represents DMSO vehicle control. Protein expression was determined by western blotting.

Figure 9 Abundance of MNK-regulated proteins in CGP57380-treated BT474 cells. BT474 cells were treated with CGP57380 for times as indicated. Time 0 represents DMSO vehicle control. Protein expression was determined by western blotting.

Reprints and Corporate Permissions

Please note: Selecting permissions does not provide access to the full text of the article, please see our help page How do I view content?

To request a reprint or corporate permissions for this article, please click on the relevant link below:

Academic Permissions

Please note: Selecting permissions does not provide access to the full text of the article, please see our help page How do I view content?

Obtain permissions instantly via Rightslink by clicking on the button below:

If you are unable to obtain permissions via Rightslink, please complete and submit this Permissions form. For more information, please visit our Permissions help page.