788
Views
26
CrossRef citations to date
0
Altmetric
Research Paper

PDRG1, a novel tumor marker for multiple malignancies that is selectively regulated by genotoxic stress

, , , , , & show all
Pages 567-573 | Received 12 Oct 2010, Accepted 06 Dec 2010, Published online: 15 Mar 2011

Figures & data

Figure 1 PDRG expression is selectively upregulated by genotoxic stress. (A) HCT15 and NIH3T3 cells were untreated as control (C) or treated with 2 µM adramycin (Adr), 30 µM etoposide (Etop) or 20 J/m2 ultraviolet radiation (UV) for 24 hours. Total RNA preparation and northern blot analyses were done as described in Material and Methods. A human PDRG cDNA probe was used for the blot contains RNA from HCT15 cells, and a mouse PDRG cDNA probe was used for the blot containing RNA from NIH3T3 cells. The integrity of total RNA and comparable loading are shown by ethidium bromide staining of the gel prior to transfer. (B) DU145 and HS578T cells were untreated as control (C) or treated with adramycin (Adr), etoposide (Etop), camtothecin (Cam), Taxol, thapsigargin (TG) or sulindac sulfide (SD) and then harvested after 24 hours or at indicated time points. Total RNA was extracted and northern blot analyses of PDRG mRNA levels were done using human PDRG cDNA probe as described in Material and Methods. Ethidium bromide staining of the gel shows integrity of RNA and comparable loading.
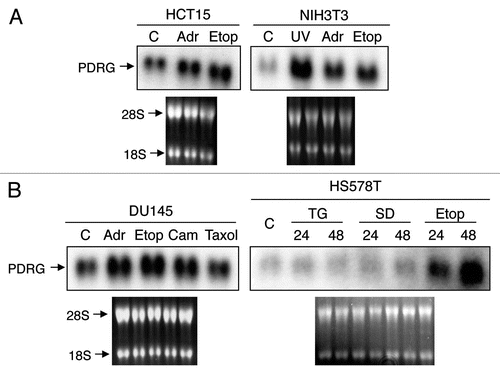
Figure 1 PDRG expression is selectively upregulated by genotoxic stress. (A) HCT15 and NIH3T3 cells were untreated as control (C) or treated with 2 µM adramycin (Adr), 30 µM etoposide (Etop) or 20 J/m2 ultraviolet radiation (UV) for 24 hours. Total RNA preparation and northern blot analyses were done as described in Material and Methods. A human PDRG cDNA probe was used for the blot contains RNA from HCT15 cells, and a mouse PDRG cDNA probe was used for the blot containing RNA from NIH3T3 cells. The integrity of total RNA and comparable loading are shown by ethidium bromide staining of the gel prior to transfer. (B) DU145 and HS578T cells were untreated as control (C) or treated with adramycin (Adr), etoposide (Etop), camtothecin (Cam), Taxol, thapsigargin (TG) or sulindac sulfide (SD) and then harvested after 24 hours or at indicated time points. Total RNA was extracted and northern blot analyses of PDRG mRNA levels were done using human PDRG cDNA probe as described in Material and Methods. Ethidium bromide staining of the gel shows integrity of RNA and comparable loading.

Figure 2 PDRG mRNA is overexpressed in human malignancies. Representative results showing PDRG expression in primary gastrointestinal tract tissue specimens. RNA samples representing matching normal (N) and tumor (T) specimens from colon, stomach and rectum were probed with PDRG cDNA probe as described in Material and Methods. Each pair indicates normal and tumor samples from a single patient. *Indicates higher PDRG mRNA level in tumor sample than that in the matching normal tissue sample.
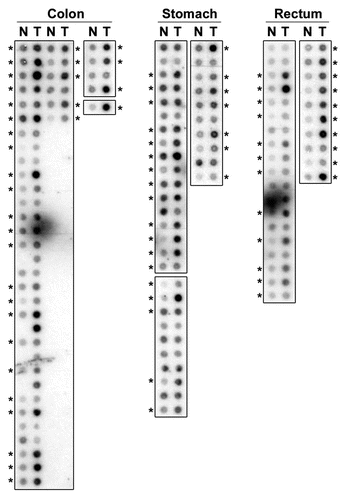
Figure 2 PDRG mRNA is overexpressed in human malignancies. Representative results showing PDRG expression in primary gastrointestinal tract tissue specimens. RNA samples representing matching normal (N) and tumor (T) specimens from colon, stomach and rectum were probed with PDRG cDNA probe as described in Material and Methods. Each pair indicates normal and tumor samples from a single patient. *Indicates higher PDRG mRNA level in tumor sample than that in the matching normal tissue sample.

Figure 3 PDRG1 protein is overexpressed in human colon cancer. Representative western blots showing PDRG expression in matching normal and tumor tissues. Protein samples prepared from primary matching normal (N) and tumor (T) tissues were subjected to western blotting using anti-PDRG antibody. Same blots were subsequently probed with anti-β-actin antibody to show loading in each lane.
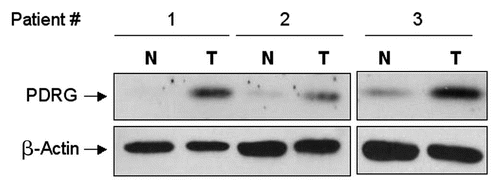
Figure 3 PDRG1 protein is overexpressed in human colon cancer. Representative western blots showing PDRG expression in matching normal and tumor tissues. Protein samples prepared from primary matching normal (N) and tumor (T) tissues were subjected to western blotting using anti-PDRG antibody. Same blots were subsequently probed with anti-β-actin antibody to show loading in each lane.

Figure 4 Immunohistochemical staining of PDRG in matched normal and cancer tissues from colon cancer patients. Frozen primary colon normal and tumor tissues from same patient were sectioned (6 µm) then fixed with 4% paraformaldehyde for 30 min. Endogenous peroxidase was quenched with hydrogen peroxide and the sections were then blocked in PBS with 10% goat sera for 20 min and incubated sequentially with anti-PDRG antibody for 1 hour, biotinylated anti-rabbit secondary antibody (Vector Laboratories, Burlingame, CA) for 45 min and ABC reagent (Vector laboratories) for 30 min. After several washes, the sections were then incubated with peroxidase substrate DAB solution (Vector laboratories) and counterstained with hematoxylin. Brown color indicates the PDRG-specific signal. Photomicrographs from different regions captured at x10 and x20 magnifications are shown. Please note that PDRG1 is predominantly expressed by the epithelial cells as indicated by arrows and the tumor sample exhibits very strong PDRG-specific staining than the matching normal tissue. Insets show sections of enlarged images from x20 photomicrographs.
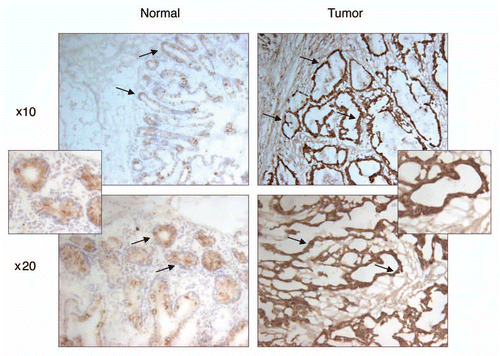
Figure 4 Immunohistochemical staining of PDRG in matched normal and cancer tissues from colon cancer patients. Frozen primary colon normal and tumor tissues from same patient were sectioned (6 µm) then fixed with 4% paraformaldehyde for 30 min. Endogenous peroxidase was quenched with hydrogen peroxide and the sections were then blocked in PBS with 10% goat sera for 20 min and incubated sequentially with anti-PDRG antibody for 1 hour, biotinylated anti-rabbit secondary antibody (Vector Laboratories, Burlingame, CA) for 45 min and ABC reagent (Vector laboratories) for 30 min. After several washes, the sections were then incubated with peroxidase substrate DAB solution (Vector laboratories) and counterstained with hematoxylin. Brown color indicates the PDRG-specific signal. Photomicrographs from different regions captured at x10 and x20 magnifications are shown. Please note that PDRG1 is predominantly expressed by the epithelial cells as indicated by arrows and the tumor sample exhibits very strong PDRG-specific staining than the matching normal tissue. Insets show sections of enlarged images from x20 photomicrographs.

Figure 5 Depletion of PDRG suppresses tumor cell growth. Top, western blot analyses using anti-PDRG antibody show depletion of endogenous PDRG expression by lentiviral-based knockdown in the RKO cells; bottom, graphic representation of MTT assay depicting decreased cell proliferation due to PDRG knockdown in RKO cells. Cells were seeded at equal density and infected with lentiviral scrambled shRNA or PDRG-specific shRNAs. Nine days after infections, equal numbers of cells were reseeded onto 24-well plates (1 × 10⁴ per well). Cell viability was determined by methyl thiazole tetrazolium (MTT) assay each day over a 7 day period. Points, mean of three independent experiments; bars, SE .
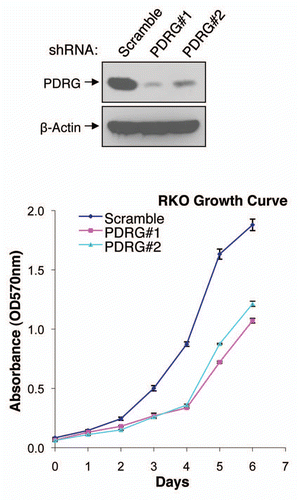
Figure 5 Depletion of PDRG suppresses tumor cell growth. Top, western blot analyses using anti-PDRG antibody show depletion of endogenous PDRG expression by lentiviral-based knockdown in the RKO cells; bottom, graphic representation of MTT assay depicting decreased cell proliferation due to PDRG knockdown in RKO cells. Cells were seeded at equal density and infected with lentiviral scrambled shRNA or PDRG-specific shRNAs. Nine days after infections, equal numbers of cells were reseeded onto 24-well plates (1 × 10⁴ per well). Cell viability was determined by methyl thiazole tetrazolium (MTT) assay each day over a 7 day period. Points, mean of three independent experiments; bars, SE .

Figure 6 PDRG interacts with PDCD7 in mammalian cells. HE K 293T cells were transiently transfected with expression vector pCEP-PDRG1 and pCEP-PDCD7 or pCEP-PDRG1 and pCEP 4 vector without PDCD7 insert. After 24 hours, cells were harvested and lysed. About 500 total lysates were precipitated with anti-myc antibody (9E10) and protein G-bead. The precipitated proteins were resolved by SDS-PAGE along with 150 µg total cell lysates. HA-tagged PDRG was detected by western blotting with rat monoclonal anti-HA antibody and myc-tagged PDCD7 was detected using mouse monoclonal anti-myc antibody (9E10).
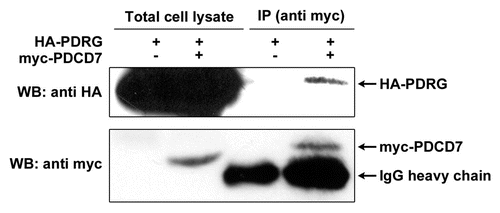
Figure 6 PDRG interacts with PDCD7 in mammalian cells. HE K 293T cells were transiently transfected with expression vector pCEP-PDRG1 and pCEP-PDCD7 or pCEP-PDRG1 and pCEP 4 vector without PDCD7 insert. After 24 hours, cells were harvested and lysed. About 500 total lysates were precipitated with anti-myc antibody (9E10) and protein G-bead. The precipitated proteins were resolved by SDS-PAGE along with 150 µg total cell lysates. HA-tagged PDRG was detected by western blotting with rat monoclonal anti-HA antibody and myc-tagged PDCD7 was detected using mouse monoclonal anti-myc antibody (9E10).

Table 1 PDRG expression in primary tumors

Supplemental material

Additional material

Download Zip (97.4 KB)

Reprints and Corporate Permissions

Please note: Selecting permissions does not provide access to the full text of the article, please see our help page How do I view content?

To request a reprint or corporate permissions for this article, please click on the relevant link below:

Academic Permissions

Please note: Selecting permissions does not provide access to the full text of the article, please see our help page How do I view content?

Obtain permissions instantly via Rightslink by clicking on the button below:

If you are unable to obtain permissions via Rightslink, please complete and submit this Permissions form. For more information, please visit our Permissions help page.