472
Views
16
CrossRef citations to date
0
Altmetric
Clinical Study

Bortezomib treatment causes remission in a Ph+ALL patient and reveals FoxO as a theranostic marker

, , , &
Pages 552-558 | Received 29 Nov 2010, Accepted 29 Dec 2010, Published online: 15 Mar 2011

Figures & data

Figure 1 Bone marrow findings and FoxO3 expression in a Ph+ALL patient at diagnosis and after treatment with bortezomib. (A) H&E stained slide of a bone marrow trephine core biopsy at diagnosis revealed marrow space occupied by immature precursor B-lymphoblasts. Blasts (indicated by arrows; ∼90% of marrow cellularity) have an open chromatin, sparse cytoplasm and high N:C ratio. Rare scattered hematopoietic elements were present (x1,000). (B) FoxO3 immunostains (1:100; Millipore, Billerica, MA) revealed that most of these immature blasts lacked FoxO3 (magnification x1,000). (C) H&E slide of bone marrow core biopsy after treatment with bortezomib. The marrow was hypocellular for age (∼10% cellularity). It revealed only rare blasts along with normal hematopoietic elements (x100). (D) FoxO3 stains revealed that FoxO3 expression was seen in small clusters of cells within the interstitium (arrows; x100), including precursor cells localized to the endosteal niche (inset; x1,000). Reticle bar represents 100 µ.
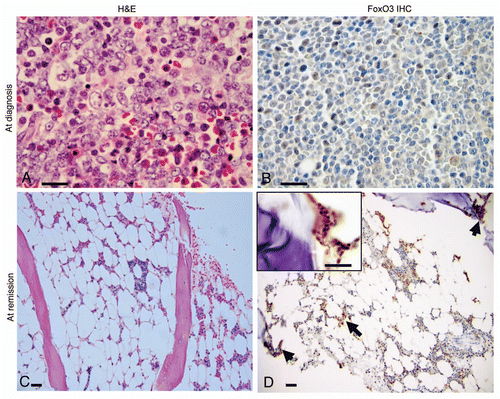
Figure 1 Bone marrow findings and FoxO3 expression in a Ph+ALL patient at diagnosis and after treatment with bortezomib. (A) H&E stained slide of a bone marrow trephine core biopsy at diagnosis revealed marrow space occupied by immature precursor B-lymphoblasts. Blasts (indicated by arrows; ∼90% of marrow cellularity) have an open chromatin, sparse cytoplasm and high N:C ratio. Rare scattered hematopoietic elements were present (x1,000). (B) FoxO3 immunostains (1:100; Millipore, Billerica, MA) revealed that most of these immature blasts lacked FoxO3 (magnification x1,000). (C) H&E slide of bone marrow core biopsy after treatment with bortezomib. The marrow was hypocellular for age (∼10% cellularity). It revealed only rare blasts along with normal hematopoietic elements (x100). (D) FoxO3 stains revealed that FoxO3 expression was seen in small clusters of cells within the interstitium (arrows; x100), including precursor cells localized to the endosteal niche (inset; x1,000). Reticle bar represents 100 µ.

Figure 2 Clinical course and remission in the patient with Ph+ALL treated with bortezomib. The graph shows persistence of BCR-ABL-positive disease despite correction of white counts in the initial phase of the disease, when the patient was treated with leukopheresis, followed by induction chemotherapy and TKI (Imatinib). Bortezomib was added at approximately 6 months following diagnosis. Bortezomib and rituxan are maintained at alternate months, while dasatinib is given orally every day. Her BCR-ABL expression levels, by molecular analysis (RT-PCR for p210 transcripts), turned negative following this combination regimen. The data is truncated at 35 months. The patient maintains a similar status at 48 months at last follow-up.
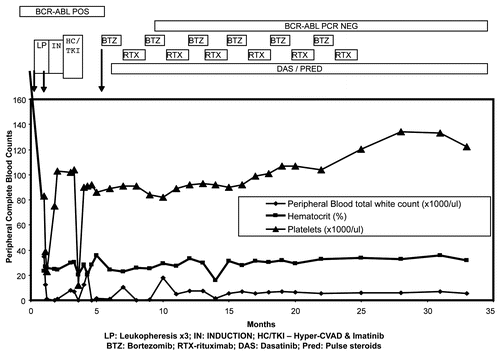
Figure 2 Clinical course and remission in the patient with Ph+ALL treated with bortezomib. The graph shows persistence of BCR-ABL-positive disease despite correction of white counts in the initial phase of the disease, when the patient was treated with leukopheresis, followed by induction chemotherapy and TKI (Imatinib). Bortezomib was added at approximately 6 months following diagnosis. Bortezomib and rituxan are maintained at alternate months, while dasatinib is given orally every day. Her BCR-ABL expression levels, by molecular analysis (RT-PCR for p210 transcripts), turned negative following this combination regimen. The data is truncated at 35 months. The patient maintains a similar status at 48 months at last follow-up.

Figure 3 Bone marrow expression of FoxO3 (IHC) (x1,000) in representative patient samples with with Ph+ALL, Ph−ALL and ‘normal’ controls. (A) Bone marrow trephine core biopsies of patients with Ph+ALL show marked downregulation of FoxO3 in all blasts (x1,000). Note the near-complete absence of maturation and absence of cytoplasmic and nuclear FoxO3. Rare myeloid elements show positive staining with FoxO3 (internal control). (B) A patient with Ph-negative ALL. The specimen is cellular with immature blasts. Most blasts are positive for FoxO3 expression in cytoplasm/nuclear localization. (C) Normal controls. The cellularity is sparser than leukemic marrows and shows hematopoietic cells in the insterstitium of normal marrow space and adipose tissue. The hematopoietic cells, specifically myeloid cells, show strong expression of FoxO3.
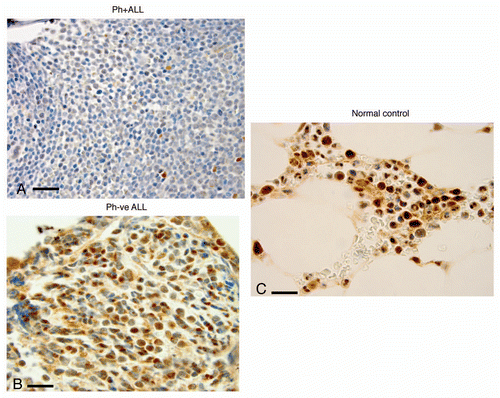
Figure 3 Bone marrow expression of FoxO3 (IHC) (x1,000) in representative patient samples with with Ph+ALL, Ph−ALL and ‘normal’ controls. (A) Bone marrow trephine core biopsies of patients with Ph+ALL show marked downregulation of FoxO3 in all blasts (x1,000). Note the near-complete absence of maturation and absence of cytoplasmic and nuclear FoxO3. Rare myeloid elements show positive staining with FoxO3 (internal control). (B) A patient with Ph-negative ALL. The specimen is cellular with immature blasts. Most blasts are positive for FoxO3 expression in cytoplasm/nuclear localization. (C) Normal controls. The cellularity is sparser than leukemic marrows and shows hematopoietic cells in the insterstitium of normal marrow space and adipose tissue. The hematopoietic cells, specifically myeloid cells, show strong expression of FoxO3.

Figure 4 Data collated from IHC expression and , showing comparison between the two groups (Philadelphia chromosome-positive ALL versus Ph-negative disease/Controls). Most cases in the Ph-negataive group showed positive expression of FoxO3 (2/10), whereas only (3/14) cases showed positive expression in the Ph+ALL group. A two-tailed Fisher's exact test revealed the difference between the groups to be significant (p = 0.01).
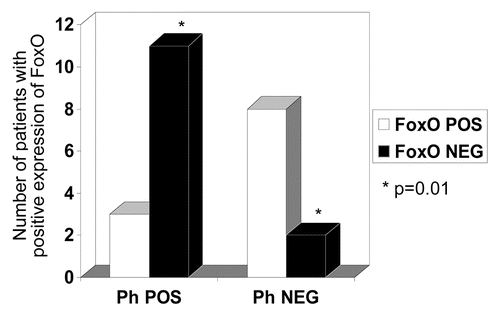
Figure 4 Data collated from IHC expression and Table 1, showing comparison between the two groups (Philadelphia chromosome-positive ALL versus Ph-negative disease/Controls). Most cases in the Ph-negataive group showed positive expression of FoxO3 (2/10), whereas only (3/14) cases showed positive expression in the Ph+ALL group. A two-tailed Fisher's exact test revealed the difference between the groups to be significant (p = 0.01).

Figure 5 FoxO3 expression within normal hematopoietic cells. (A) FoxO3 expression is seen in the cytoplasm or nucleus of myeloid progenitor cells (thick arrows). (B and C) FoxO3 expression in more mature granulocytes (g): these mature cells show a nuclear dot-like positivity, specifically in the chromocentric regions (thin arrow of B). (C and D) FoxO3 expresion in erythroid precursors (marked as e) with very dim (D) or negative (C) expression of cytoplasmic FoxO3. The reticle bar represents ∼10 µ in each figure.
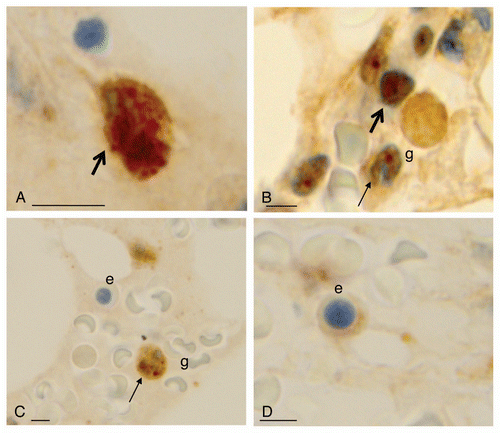
Figure 5 FoxO3 expression within normal hematopoietic cells. (A) FoxO3 expression is seen in the cytoplasm or nucleus of myeloid progenitor cells (thick arrows). (B and C) FoxO3 expression in more mature granulocytes (g): these mature cells show a nuclear dot-like positivity, specifically in the chromocentric regions (thin arrow of B). (C and D) FoxO3 expresion in erythroid precursors (marked as e) with very dim (D) or negative (C) expression of cytoplasmic FoxO3. The reticle bar represents ∼10 µ in each figure.

Table 1A Demographics and results of FoxO3 expression of the 24 bone marrow samples analyzed

Table 1B Frequency distribution of FoxO3 expression among the Ph+ and Ph−ve cases

Reprints and Corporate Permissions

Please note: Selecting permissions does not provide access to the full text of the article, please see our help page How do I view content?

To request a reprint or corporate permissions for this article, please click on the relevant link below:

Academic Permissions

Please note: Selecting permissions does not provide access to the full text of the article, please see our help page How do I view content?

Obtain permissions instantly via Rightslink by clicking on the button below:

If you are unable to obtain permissions via Rightslink, please complete and submit this Permissions form. For more information, please visit our Permissions help page.