740
Views
16
CrossRef citations to date
0
Altmetric
Research Paper

Depletion of tissue factor suppresses hepatic metastasis and tumor growth in colorectal cancer via the downregulation of MMPs and the induction of autophagy and apoptosis

, , , , , , , , , , , , , , & show all
Pages 896-907 | Received 23 Jun 2011, Accepted 09 Aug 2011, Published online: 15 Nov 2011

Figures & data

Figure 1. TF immunoreactivity in CRC samples. (A) TF immunostaining in clinical samples. (N) Normal colon tissue; (T) CRC tissues; (L) metastatic liver tissue. Scale bar = 50 mm. (B) Protein gel blot analysis of TF expression in normal colon (N), CRC (T) and liver metastasis (L) tissues. Quantitative data were presented as mean ± SEM, n = 3. (C) The correlation of TF immunoreactivity with the survival rate of CRC patients. The overall survival rate of patients with high TF immunoreactivity was significantly lower than those patients with low TF immunoreactivity. (hazard ratio: 1.886, 95% CI: 1.353–2.629, p < 0.001).
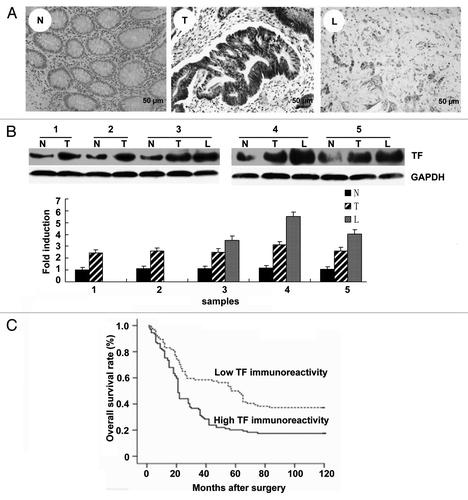
Figure 1. TF immunoreactivity in CRC samples. (A) TF immunostaining in clinical samples. (N) Normal colon tissue; (T) CRC tissues; (L) metastatic liver tissue. Scale bar = 50 mm. (B) Protein gel blot analysis of TF expression in normal colon (N), CRC (T) and liver metastasis (L) tissues. Quantitative data were presented as mean ± SEM, n = 3. (C) The correlation of TF immunoreactivity with the survival rate of CRC patients. The overall survival rate of patients with high TF immunoreactivity was significantly lower than those patients with low TF immunoreactivity. (hazard ratio: 1.886, 95% CI: 1.353–2.629, p < 0.001).

Table 1. The correlation of TF immunoreactivity with clinical parameters of CRC samples

Figure 2. TF expression in colon cancer cell lines is correlated with the invasion ability of the cells. (A) Real-time PCR analysis of TF mRNA level in colon cancer cell lines. Quantitative data were presented as mean ± SEM, n = 3. (B) Protein gel blot analysis of TF protein level in colon cancer cell lines. (C) Gelatin zymography analysis of MMP2/MMP9 enzymatic activity. (D) Transwell assay of the invasion ability of the cell lines.
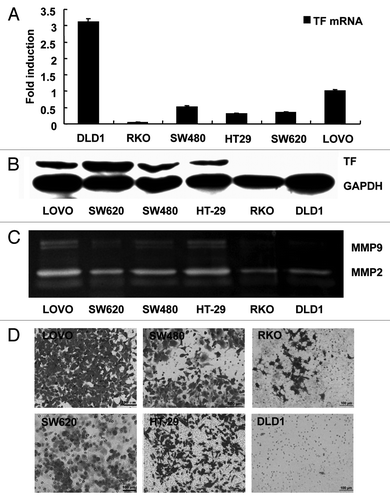
Figure 2. TF expression in colon cancer cell lines is correlated with the invasion ability of the cells. (A) Real-time PCR analysis of TF mRNA level in colon cancer cell lines. Quantitative data were presented as mean ± SEM, n = 3. (B) Protein gel blot analysis of TF protein level in colon cancer cell lines. (C) Gelatin zymography analysis of MMP2/MMP9 enzymatic activity. (D) Transwell assay of the invasion ability of the cell lines.

Figure 3 (See previous page). TF knockdown suppresses the migration and invasion of LOVO cells. (A) Real-time PCR analysis of TF mRNA level in different groups of LOVO cells. (B) Protein gel blot analysis of TF protein level in different groups of LOVO cells. (C) Gelatin zymography analysis of MMP2/MMP9 enzymatic activity in different groups of LOVO cells. (D) Transwell assay of the migration and invasion ability of different groups of LOVO cells. (E) Would healing assay of the migration of different groups of LOVO cells photographs were taken at 0, 24 and 48 h after the wound was made by confocal microscopy. Representative photographs (upper) and quantification (lower) were shown. (F) Protein gel blot analysis of MMP2, MMP9, c-fos and c-jun protein level in different groups of LOVO cells. Magnification: × 200. Data shown were the representative set of three independent experiments. *p < 0.05, **p < 0.01, vs. the empty vector group.
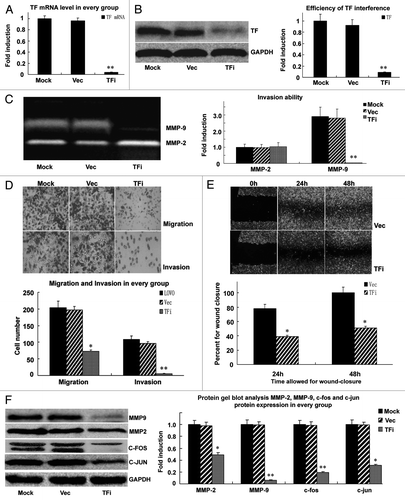
Figure 3 (See previous page). TF knockdown suppresses the migration and invasion of LOVO cells. (A) Real-time PCR analysis of TF mRNA level in different groups of LOVO cells. (B) Protein gel blot analysis of TF protein level in different groups of LOVO cells. (C) Gelatin zymography analysis of MMP2/MMP9 enzymatic activity in different groups of LOVO cells. (D) Transwell assay of the migration and invasion ability of different groups of LOVO cells. (E) Would healing assay of the migration of different groups of LOVO cells photographs were taken at 0, 24 and 48 h after the wound was made by confocal microscopy. Representative photographs (upper) and quantification (lower) were shown. (F) Protein gel blot analysis of MMP2, MMP9, c-fos and c-jun protein level in different groups of LOVO cells. Magnification: × 200. Data shown were the representative set of three independent experiments. *p < 0.05, **p < 0.01, vs. the empty vector group.

Figure 4. TF knockdown suppresses hepatic metastasis of colorectal cancer in vivo. (A) in the control group, infusion of cancer cells resulted in development of macroscopic hepatic tumors in 19/20 mice (Vec). In the TF knockdown group, macroscopic hepatic tumors were visible on the liver surface in 2/20 mice (TFi) (p < 0.001 vs. control). Black arrows indicated orthotopic tumor, hollow arrows indicated hepatic metastasis. (B) Macroscopic examination of the liver. In the control group, metastasis was visible macroscopically. By contrast, in the TF knockdown group, no metastasis was visible macroscopically. (C) Orthotopic tumor weight (g) in the two group after 3 mo. Significant difference in orthotopic tumor growth between the two groups. *p < 0.05, **p < 0.01, vs. empty vector group.
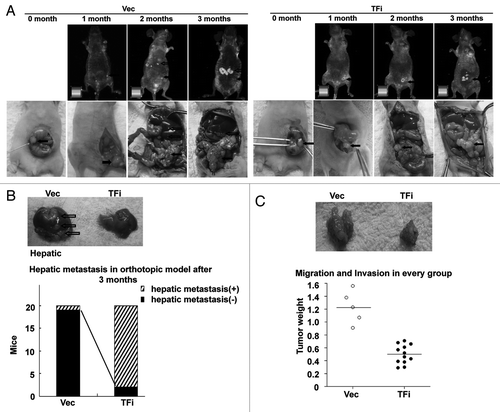
Figure 4. TF knockdown suppresses hepatic metastasis of colorectal cancer in vivo. (A) in the control group, infusion of cancer cells resulted in development of macroscopic hepatic tumors in 19/20 mice (Vec). In the TF knockdown group, macroscopic hepatic tumors were visible on the liver surface in 2/20 mice (TFi) (p < 0.001 vs. control). Black arrows indicated orthotopic tumor, hollow arrows indicated hepatic metastasis. (B) Macroscopic examination of the liver. In the control group, metastasis was visible macroscopically. By contrast, in the TF knockdown group, no metastasis was visible macroscopically. (C) Orthotopic tumor weight (g) in the two group after 3 mo. Significant difference in orthotopic tumor growth between the two groups. *p < 0.05, **p < 0.01, vs. empty vector group.

Figure 5 (See previous page). TF knockdown induces autophagy and apoptosis of LOVO cells. (A) colony formation assay showing inhibition of colony formation ability in LOVO cells depleted of TF. (B) Histochemical staining of MAP1LC3B in LOVO cells. magnification ( × 400). (C and D) AnnexinV-PE/7AAD staining of apoptotic LOVO cells as analyzed by FCM (C) and confocal microscopy (D). (E) Electron microscopy showing the activation of autophagy in LOVO cells depleted of TF, in which autophagic vesicles were distinguished from other vesicles by the presence of a double membrane. The apoptotic cells exhibited the typical high density nucleic condensation, nuclei fragmentation and apoptotic bodies. (F) Protein gel blot analysis of MAP1LC3B, ATG5, caspase-3, caspase-9 and PARP protein level in different groups of LOVO cells. *p < 0.05, **p < 0.01, vs. empty vector group.
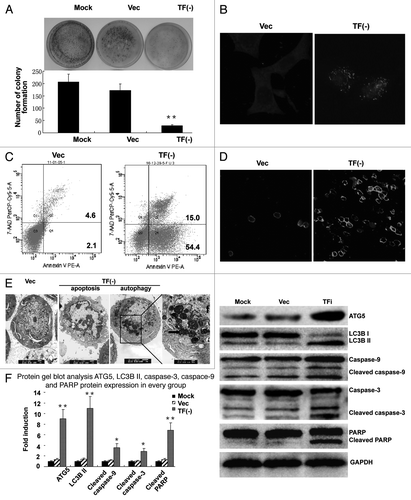
Figure 5 (See previous page). TF knockdown induces autophagy and apoptosis of LOVO cells. (A) colony formation assay showing inhibition of colony formation ability in LOVO cells depleted of TF. (B) Histochemical staining of MAP1LC3B in LOVO cells. magnification ( × 400). (C and D) AnnexinV-PE/7AAD staining of apoptotic LOVO cells as analyzed by FCM (C) and confocal microscopy (D). (E) Electron microscopy showing the activation of autophagy in LOVO cells depleted of TF, in which autophagic vesicles were distinguished from other vesicles by the presence of a double membrane. The apoptotic cells exhibited the typical high density nucleic condensation, nuclei fragmentation and apoptotic bodies. (F) Protein gel blot analysis of MAP1LC3B, ATG5, caspase-3, caspase-9 and PARP protein level in different groups of LOVO cells. *p < 0.05, **p < 0.01, vs. empty vector group.

Figure 6. TF knockdown activates UPR signaling to regulate autophagy in LOVO cells. (A) Protein gel blot analysis showing the activation of UPR signaling in LOVO cells depleted of TF. (B) siRNA-mediated knockdown of PERK abrogated the upregulation of MAP1LC3B, ATG5, ATF4 and CHOP in LOVO cells depleted of TF. The data were mean ± SEM from three independent experiments.
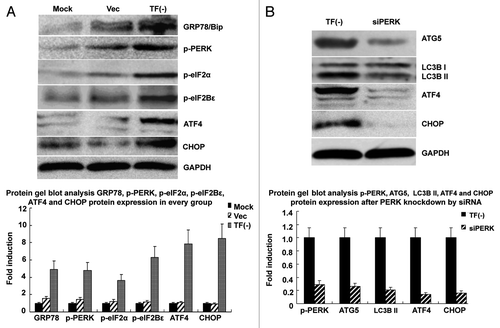
Figure 6. TF knockdown activates UPR signaling to regulate autophagy in LOVO cells. (A) Protein gel blot analysis showing the activation of UPR signaling in LOVO cells depleted of TF. (B) siRNA-mediated knockdown of PERK abrogated the upregulation of MAP1LC3B, ATG5, ATF4 and CHOP in LOVO cells depleted of TF. The data were mean ± SEM from three independent experiments.

Reprints and Corporate Permissions

Please note: Selecting permissions does not provide access to the full text of the article, please see our help page How do I view content?

To request a reprint or corporate permissions for this article, please click on the relevant link below:

Academic Permissions

Please note: Selecting permissions does not provide access to the full text of the article, please see our help page How do I view content?

Obtain permissions instantly via Rightslink by clicking on the button below:

If you are unable to obtain permissions via Rightslink, please complete and submit this Permissions form. For more information, please visit our Permissions help page.