Figures & data
Figure 1. Fibroblasts induce resistance to hormonal therapy in MCF7 cells. (A) MCF7 cells were plated in homotypic culture or in coculture with fibroblasts at a ratio of 1:5 MCF7 cells to fibroblasts. The next day, cells were treated with 10 µM tamoxifen or vehicle alone (ethanol, control media) for 24 h. Apoptosis was measured with annexin V staining. Note that MCF7 cells in coculture are resistant to tamoxifen-induced apoptosis (4.4-fold reduction), compared with MCF7 single cells treated with tamoxifen (compare third and fourth bar) (p = 0.0002). (B) MCF7 cells were plated in homotypic culture or in coculture with fibroblasts at a ratio of 1:5 MCF7 cells to fibroblasts. The next day, cells were treated with 10 µM fulvestrant or vehicle alone (DMSO, control media) for 48 h. Apoptosis was measured with annexin V staining. Note that MCF7 cells in coculture show a ~2.5-fold reduction of fulvestrant-induced apoptosis compared with single cell culture treated with fulvestrant (p = 0.01). These results suggest that fibroblasts induce tamoxifen-resistance.
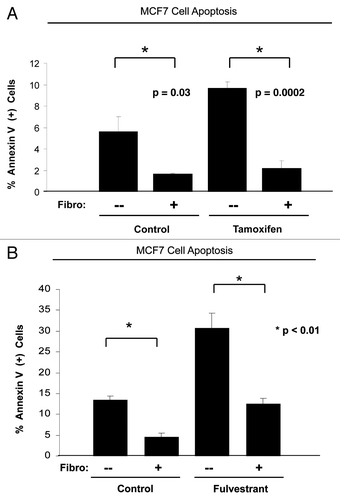
Figure 2. Lactate and ketone bodies confer tamoxifen-resistance in MCF7 cells. MCF7 cells were plated in homotypic culture. The next day, cells were incubated with 10 mM β-hydroxybutyrate (BHB), 10 mM butanediol (BND) or 10 mM L-lactate. After 24 h, 10 µM tamoxifen or vehicle alone (ethanol) was added for an additional 24 h. Apoptosis was measured with annexin V and PI staining. Note that as expected, tamoxifen induces a ~2-fold increase in early apoptosis (annexin V + and PI -), compared with vehicle alone treated cells. However, treatment with lactate and ketone bodies abolishes tamoxifen-induced cell death, suggesting that lactate and ketone bodies confer tamoxifen-resistance (p < 0.03, vs. all conditions).
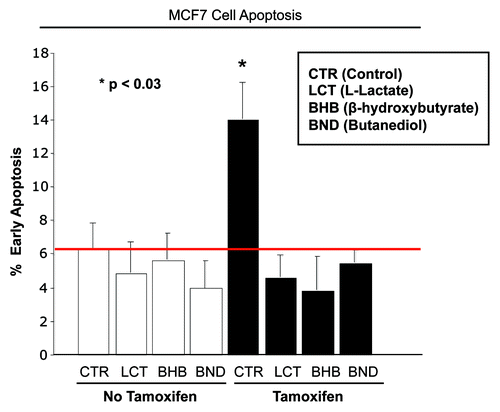
Figure 3. Metformin overcomes the tamoxifen-resistance of cocultured MCF7 cells. (A) Apoptosis: MCF7 cells were plated in coculture with fibroblasts at a ratio of 1:5 MCF7 cells to fibroblasts. The next day, 1 µM tamoxifen, 100 µM metformin or tamoxifen-metformin combination were administered for 24 h. Apoptosis was measured with annexin V and PI staining. In the left panel, the percentage of MCF7 cells undergoing cell death (annexin V+ and/or PI+) is displayed. In the right panel, the percentage of annexin V+ MCF7 cells is displayed. Note that the treatment of cocultured MCF7 cells with tamoxifen or metformin does not induce cell death. However, the treatment with the combination of tamoxifen and metformin induces a more than 2-fold increase in apoptotic cell death of cocultured MCF7 cells, compared with control cells, indicating that the combination of tamoxifen and metformin is sufficient to overcome the fibroblast-induced tamoxifen resistance (p = 0.006 and p = 0.002, for the left and right panels, respectively). (B) Glucose uptake: The glucose uptake assay was performed on cocultures of fibroblasts and MCF7 cells, using 2-NBDG fluorescence uptake. The ratio of glucose uptake (fibroblasts to MCF7 cells) was calculated as a measure of metabolic coupling between fibroblasts and MCF7 cells. Note that in untreated cocultures, the ratio of glucose uptake between fibroblasts and MCF7 cells is about 2, indicating that fibroblasts take up about two times more glucose than MCF7 cells. This is consistent with the idea of a metabolic coupling between fibroblasts and MCF7 cells. However, the combination of metformin with tamoxifen normalizes the glucose uptake ratio in cocultured cells. Note that upon treatment with the combination of metformin and tamoxifen, the glucose uptake ratio is about 1.2, compared with 1.8 under control conditions (p = 1.6 x 10⁻⁵). These results indicate that the combination of metformin with tamoxifen disrupts the metabolic coupling between fibroblasts and MCF7 cells.
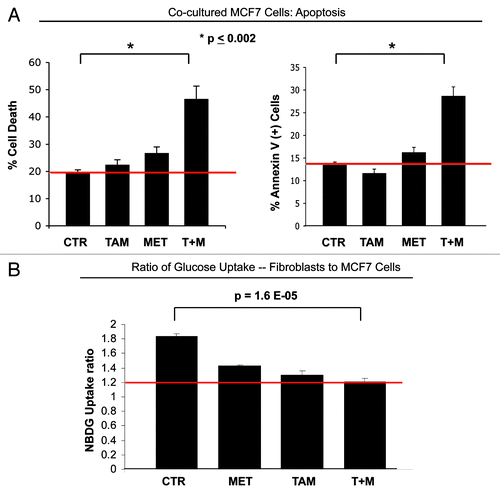
Figure 4. ATO overcomes resistance to apoptosis of cocultured MCF7 cells. (A) Apoptosis: MCF7 cells were plated in coculture with fibroblasts at a ratio of 1:5 MCF7 cells to fibroblasts. After 24 h, 12 µM tamoxifen, 20 µM ATO or the combination of tamoxifen and ATO were administered for 24 h. Apoptosis was measured with annexin V and PI staining. In the left panel, the percentage of cell death (annexin V+ and/or PI+) of MCF7 cells is displayed. In the right panel, the percentage of annexin V+ MCF7 cells is displayed. Note that treatment with ATO overcomes the resistance to apoptosis of cocultured MCF7 cells. Cocultured MCF7 cells treated with ATO or with the combination of ATO and tamoxifen display more than 2-fold increase in apoptotic cell death compared with control cocultured cells. (B and C) Glucose uptake: MCF7-RFP (+) cells were plated in coculture with fibroblasts at a ratio of 1:5 MCF7 cells to fibroblasts. After 24 h, 12 µM tamoxifen, 10 µM ATO or both were administered for 24 h. The glucose uptake of MCF7-RFP (+) cells was measured using 2-NBDG fluorescence uptake by flow cytometry. (B) Note that ATO induces a 2-fold increase of glucose uptake by cocultured MCF7 compared with control untreated and tamoxifen-treated cells (p = 6 ×10⁻⁶). (C) The ratio of glucose uptake (fibroblasts to MCF7 cells) was calculated as a measure of the metabolic coupling between fibroblasts and MCF7 cells. Note that treatment with ATO and with the combination of tamoxifen and ATO reverses the metabolic coupling between MCF7 cells and fibroblasts in coculture. The glucose uptake ratio between fibroblasts and MCF7 cells nearly equalizes upon treatment with ATO and with the tamoxifen and ATO combination, changing from 1.8 under control conditions to 1.2. p = 0.002 CTR vs ATO, p = 0.0009 CTR vs ATO+T.
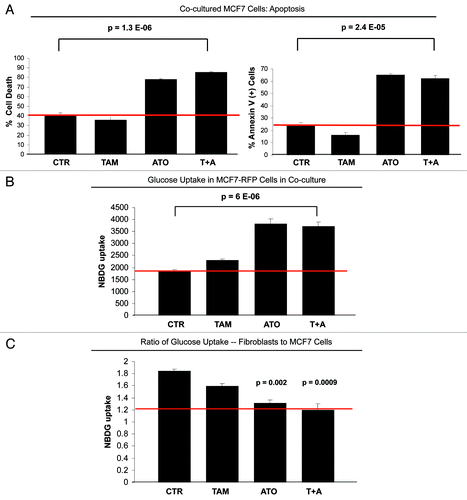
Figure 5. Tamoxifen induces TIGAR upregulation in cocultured MCF7 cells. (A) Fibroblast-MCF7 cell cocultures were cultured for 1 d with 12 µM tamoxifen or with vehicle alone. Then, cells were fixed and immuno-stained with anti-TIGAR (red) and anti K8–18 (green) antibodies. Nuclei were counterstained with DAPI (blue). TIGAR staining (red only) is shown in the top panels to better appreciate the tamoxifen-induced TIGAR upregulation in MCF7 cells. Original magnification 40x. (B) TIGAR is highly expressed in human epithelial breast cancer samples with loss of stromal Cav-1. Paraffin-embedded tissue sections from human breast cancer samples lacking Cav-1 were immunostained with antibodies directed against TIGAR. Slides were counterstained with hematoxylin. Note that TIGAR is highly expressed preferentially in epithelial breast cancer cells while stromal cells lack TIGAR expression. Original magnification, 40x.
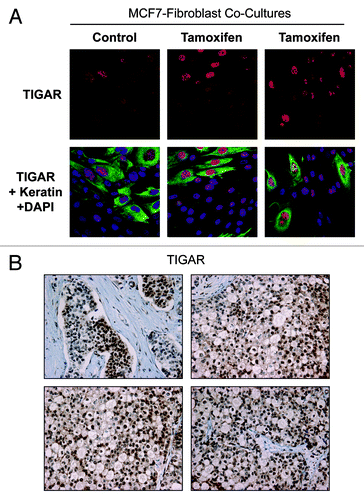
Figure 6. Generation of TIGAR overexpressing MCF7 cells. MCF7 cells recombinantly overexpressing TIGAR and empty vector control (LV-105) were generated and subjected to protein gel analysis with antibodies against TIGAR. As expected, the TIGAR overexpressing MCF7 cell line shows higher levels of TIGAR than the control. β-tubulin was used as an equal loading control.
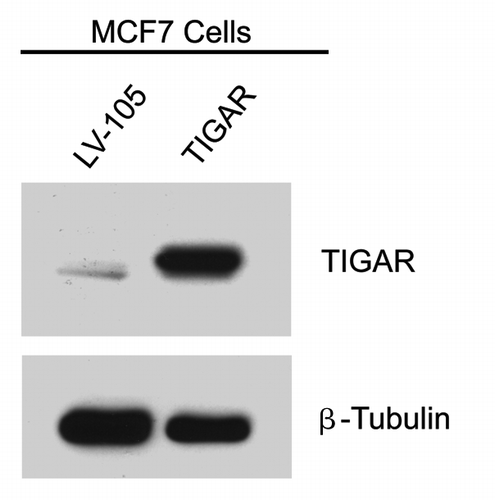
Figure 7. TIGAR overexpression mediates tamoxifen-resistance in MCF7 cells. TIGAR-MCF7 cells and control MCF7 cells were treated with 12 µM tamoxifen or vehicle alone for 24 h. Apoptosis was measured by annexin V and PI. Left panel: Percentage of annexin V+ MCF7 cells. Right panel: Percentage of MCF7 cell death (annexin V+ and/or PI+). Note that upon tamoxifen treatment, TIGAR overexpressing MCF7 cells display a nearly 2-fold decrease in apoptosis as compared with Lv-105 control MCF7 cells, indicating that TIGAR expression is one of the mechanisms mediating tamoxifen resistance in breast cancer cells. (p = 0.002 and p = 0.0001 respectively).
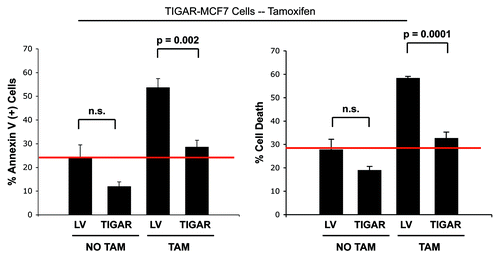
Figure 8. TIGAR overexpressing MCF7 cells are resistant to ATO-induced apoptosis. (A) Apoptosis. TIGAR-MCF7 cells and control MCF7 cells were treated for 24 h with 10 µM ATO and apoptosis was measured by annexin V and PI. Note that MCF7 cells overexpressing TIGAR show a 1.8-fold decrease in apoptosis as compared with control LV-MCF7 cells, suggesting that TIGAR induces drug resistance (p = 0.008). (B) Lactate Assay. Lactate production was measured on the cell culture media of TIGAR-MCF7 cells and control LV-MCF7 cells treated with 10 µM ATO or vehicle alone for 24 h. Note that ATO treatment induces a significant increase in lactate production in control Lv-MCF7 cells. However, upon ATO treatment, MCF7 cells overexpressing TIGAR generate less lactate than LV-MCF7 cells. After ATO treatment, control LV-MCF7 cells show a much larger increase in lactate production, compared with MCF7 cells overexpressing TIGAR (p = 0.0045).
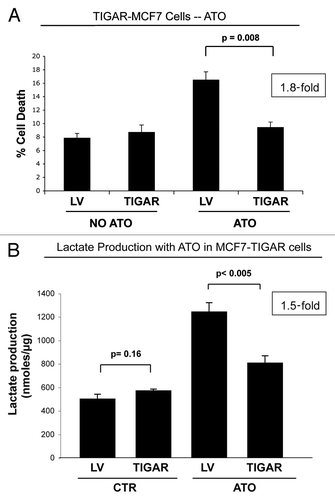
Figure 9. Fibroblasts induce drug resistance in MCF7 cells. To evaluate if fibroblasts protect cancer cells against cell death induced by known chemotherapy agents, MCF7 cells were cultured alone or cocultured with GFP (+) fibroblasts with 50 nM doxorubicin and 30 nM ABT-888 (a PARP inhibitor) for 24 h. To quantify cell viability, GFP (-) cell (MCF7 cells) numbers were measured using flow cytometry. (A) Homotypic cultures: Note that treatment with doxorubicin and ABT-888 greatly decreases the MCF7 cell viability, by 11.6 and 6.8-fold as compared with vehicle alone control (p = 0.001 and p = 0.007 respectively). (B) Cocultures: Note that treatment with doxorubicin and ABT-888 does not affect the viability of MCF7 cells in coculture with fibroblasts, suggesting that fibroblasts induce drug-resistance (p = 0.96 and p = 0.71 respectively).
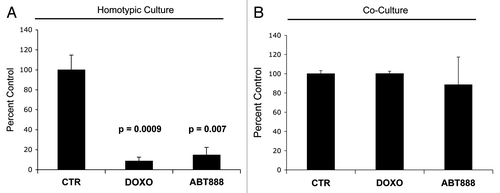
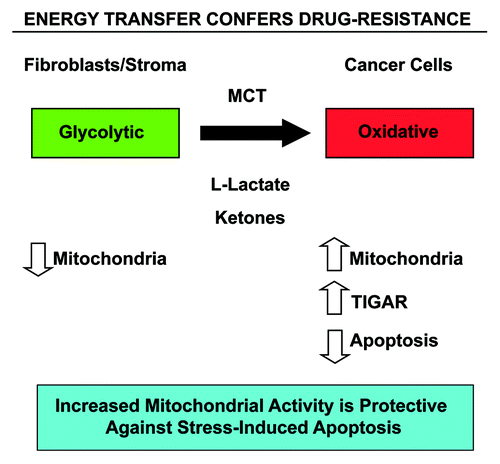
Figure 10. Energy transfer confers chemo-resistance in cancer cells. Schematic diagram summarizing our current findings. See text for details. Note that glycolytic fibroblasts provide nutrients (such as L-lacate and ketones) to fuel oxidative mitochondrial metabolism in epithelial cancer cells. This, in turn, drives protection against stress-induced apoptosis that is normally triggered by anticancer drugs, conferring drug-resistance. Specific MCT transporters allow the shuttling of L-lactate and ketones from fibroblasts (MCT4) to cancer cells (MCT1) (see reference 52 for details). Thus, fibroblasts and cancer cells are metabolically-coupled, in a form of “parasitic cancer metabolism.” This mechanism provides important new “druggable” targets for overcoming chemo-resistance, such as MCTs and TIGAR, among others. MCT, monocarboxylate transporters.