Figures & data
Figure 1. NCTD inhibits melanoma cell survival. (A) Inhibitory effects of CTD and NCTD on 1205Lu cells. The cytotoxicity of CTD and NCTD was evaluated using the MTT assay. Three independent experiments were performed. (B–E) Effect of NCTD on 1205Lu, WM115A, Sbcl2 and WM35 cells. The cytotoxicity of NCTD and temozolomide was evaluated using the MTT assay. Melanoma cells were treated for 12 or 24 h in the presence of various concentrations of NCTD or temozolomide as indicated. * Indicates p < 0.05, compared with corresponding temozolomide treated melanoma cells.
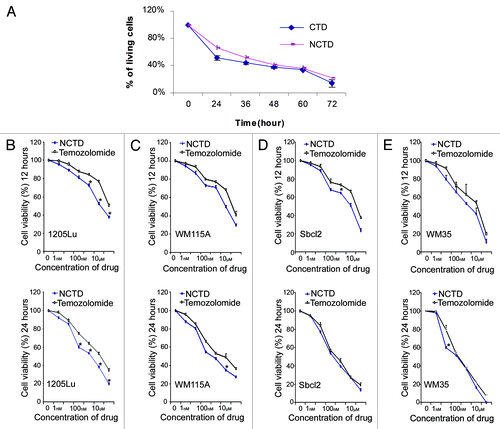
Figure 2. NCTD induces apoptosis in melanoma cells. Melanocyte, WM35 and 1205Lu cells were treated with different concentrations of NCTD (0, 1, 10 and 100 µM) for 24 h, stained with Annexin V and analyzed by FACS analysis. Column (A) percentage of apoptotic melanocytes after NCTD treatment; Column (B) percentage of apoptotic WM35 cells after NCTD treatment; Column (C) percentage of apoptotic 1205Lu cells after NCTD treatment. Three independent experiments were performed.
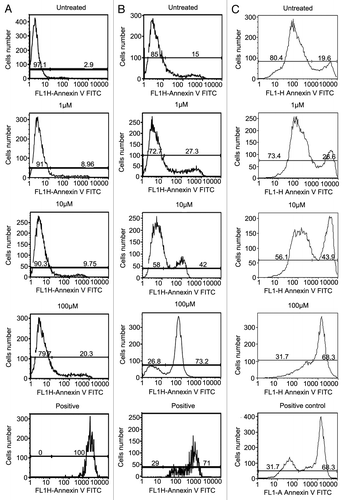
Figure 3. NCTD induces TR3 mitochondrial translocation in melanoma cells. (A) Melanoma cells were treated with NCTD (6.5 µM) for 0–2 h. Mitochondrial (for TR3 and cytochrome C), cytoplasmic (for cyto-cytochrome C) or nuclear (for TR3) proteins were isolated from the melanoma cells and analyzed by protein gel blot analysis. HSP60 was used as a loading control for mitochondrial proteins. β-actin was used as a loading control for total protein. Representative blot from three repeats was shown. (B) Melanoma cells were transfected with TR3-GFP and then treated with PBS, CTD or NCTD for 3 h. HSP60 staining was used to visualize the mitochondria in the cytoplasm. Representative fluorescent images of tumor cells after treatment were shown (n = three repeats). Bars indicate 10 μm. (C) Melanoma cells were transfected with TR3-GFP/ΔDBD and then treated with CTD or NCTD for 3 h. HSP60 staining was used to visualize the mitochondria in the cytoplasm. Representative fluorescent images of tumor cells after treatment were shown (n = three repeats). Bar indicates 10 μm. (D) Melanoma cells were transfected with either GFP-TR3 or GFP-TR3-ΔDBD, and then treated with NCTD for 3 h. BCL-2 staining was performed. Representative fluorescent images of tumor cells after treatment were shown (n = three repeats). Bar indicates 10 μm.
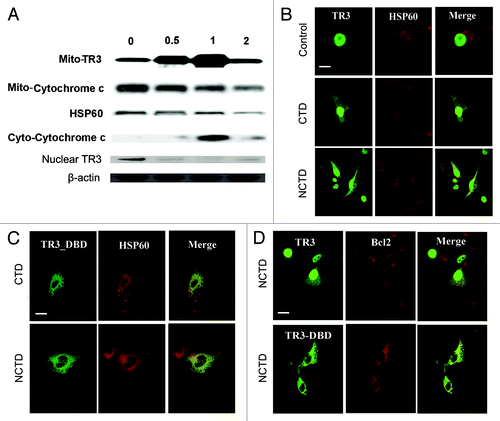
Figure 4. TR3 mediates the effects of NCTD on melanoma cells. (A) TR3 expression in melanoma cells. Radial growth phase (Sbcl2 and WM35) melanoma cells expressed higher levels of TR3 than metastatic (WM115A and 1205Lu) melanoma cells. β-actin was used as a loading control (representative blot from three experiments). (B) TR3 knockdown or overexpression. 1205Lu cells were transfected with TR3 shRNA or overexpression vectors. Protein gel blots were performed to confirm the levels of TR3 expression in these cells. β-actin was used as a loading control (representative blot from three experiments). (C) Effect of NCTD depends on TR3 expression level in melanoma cells. 1205Lu cells with TR3 knockdown, overexpression or control as well as WM35 cells were treated with different concentrations of NCTD for 24 h and cell survival was evaluated using the MTT assay. * Indicates p < 0.05, compared with 1205Lu control cells. (D) NCTD activates TR3 dependent apoptotic pathway. 1205Lu and 1205Lu with TR3 knockdown cells were treated with NCTD or vehicle for 24 h and cell lysates were subjected to protein gel blot with antibodies to Bax, Bcl2, cleaved caspase-3 or NF-κB2. β-actin was used as a loading control (representative blot from three experiments). (E) p53 expression after NCTD treatment. 1205Lu cells were treated with different concentrations of NCTD and then cell lysates were subjected to protein gel blot with an antibody to P53.
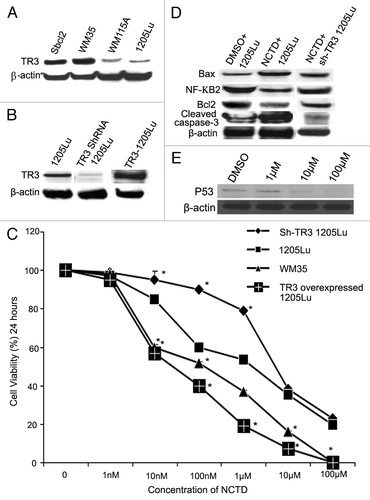
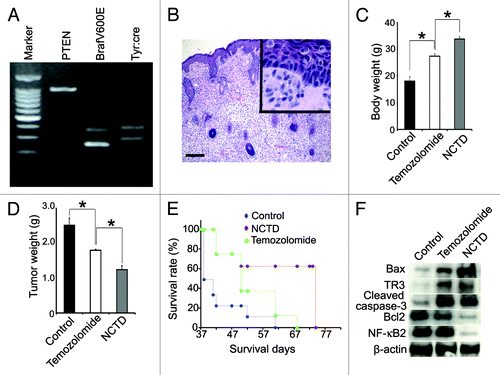
Figure 5. NCTD inhibits melanoma growth and cancerous cachexia in vivo. Melanoma was induced by applying 4-TH on Tyr::CreER; BrafCa/+; Ptenlox/lox mice. Ten mice were used in each group. (A) Typical genotype of the Tyr::CreER; BrafCa/+; Ptenlox/lox transgenic mice. (B) Histology shows pagetoid proliferation of tumor cells in the epidermis and epithelioid/spindled tumor cells in the dermis after induction (H&E), bar indicates 100 μm. (C) Effect of NCTD on body weight of melanoma bearing mice. The transgenic mice were treated with NCTD, temozolomide or DMSO and all the mice were euthanized 40 d after tumor induction and weighted. * indicates p < 0.05. (D) Effect of NCTD on tumor weight. The transgenic mice were treated with NCTD, temozolomide or DMSO and all the mice were euthanized 40 d after tumor induction and the tumors were dissected and weighted. * indicates p < 0.05. (E) Effect of NCTD on mouse survival. The transgenic mice were treated with NCTD, temozolomide or DMSO and they were euthanized according to the standard score of body condition. Kaplan-Meier survival analysis showed that NCTD prolonged the lifespan of melanoma bearing mice better than temozolomide. (F) NCTD activates TR3 dependent apoptosis pathway in vivo. Melanoma tissues were harvested from treated mice and tissue lysates are subjected to immunoblotting with antibodies to TR3, Bax, Bcl-2, cleaved caspase-3 or NF-κB2. β-actin was used as a loading control. Representative blot from three repeats is shown.