Figures & data
Figure 1 Cetuximab-resistant clones remain dependent on the EGFR signaling pathway. (A) Cetuximab growth response using cetuximab-resistant clones established from the non-small cell lung cancer (NSCLC) line NCI-H226. Parental NCI-H226 cell line, HP, and cetuximab-resistant cell lines (HC1, HC4, HC8) were treated with the indicated concentration of cetuximab. Growth was measured 72 h post treatment using the growth proliferation assay described in materials and methods. Data points are represented as mean ± SEM (n = 4). *p ≤ 0.05. (B) Cetuximab-resistant cell lines overexpress HER family members and have increased AKT, MAPK and S6 activity. Parental cells (HP) and cetuximab-resistant clones (HC1, HC4, HC8) were lysed and fractionated on SDS-PAGE followed by immunoblotting for the indicated proteins. α-Tubulin was used as a loading control. (C) Expression of EGFR in cetuximab-resistant clones by confocal immunofluorescence microscopy. EGFR expression was visualized via immunofluorescent staining in the parental HP cell line and cetuximab-resistant cell lines (HC1, HC4, HC8). The left column is the merged image of EGFR; Red, phalloidin staining of the cytoskelton; Green, EGFR staining; Blue, DNA staining; Magnification, ×400. (D) EGFR is effectively knocked down in cetuximab-resistant cell lines. Cetuximab-resistant cell lines were plated and treated with either 25 nM EGFR siRNA or scrambled siRNA. Seventy-two hours later protein was collected and fractioned by SDS-PAGE and immunoblotted for EGFR. α-Tubulin was used as a loading control. (E) Cetuximab-resistant cell lines are dependent on EGFR. Cetuximab-resistant cell lines were plated and treated with either 10 or 25 nM of EGFR siRNA, or 25 nM scrambled siRNA. Proliferation was measured at 72 h after treatment using the proliferation assay described in materials and methods. Data points are represented as mean ± SEM (n = 4). *p ≤ 0.05, **p ≤ 0.001.
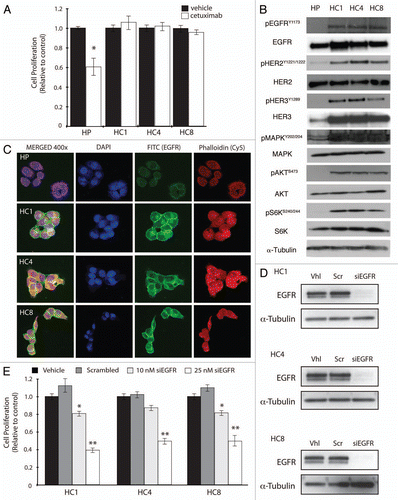
Figure 2 Cetuximab-resistant cell lines are sensitive to the EGFR targeted TKI erlotinib. (A) HER family members and downstream signaling molecules AKT and MAPK are effectively inhibited with erlotinib treatment in cetuximab-resistant cell lines. Cetuximab-resistant clones (HC1, HC4, HC8) were treated with vehicle (DMSO), cetuximab (100 nM) or erlotinib (250 or 750 nM) for 24 h. Whole cell protein lysates were fractionated on SDS-PAGE followed by immunoblotting for the indicated proteins. α-Tubulin was used as a loading control. (B) Erlotinib inhibits the proliferation of cetuximab-resistant cell lines. Parental cells (HP) and cetuximab-resistant cell lines (HC1, HC4, HC8) were plated and allowed to adhere for 24 h prior to vehicle (DMSO), cetuximab (100 nM) or erlotinib treatment: 0.25 µM, 0.75 µM or 1 uM. Growth was measured at 72 h after drug treatment using the growth proliferation assay described in experimental methods and plotted as a percentage of growth relative to untreated control cells. Data points are represented as mean ± SEM (n = 4). *p ≤ 0.05, **p ≤ 0.001. (C) Erlotinib treatment induces G1 cell cycle phase arrest in cetuximab-resistant cell lines. Cetuximab-resistant cell lines (HC1, HC4, HC8) were plated and grown for 24 h prior to treatment with vehicle (DMSO), cetuximab (100 nM) or erlotinib (250 or 750 nM) for 24 h. Cell cycle phase distribution was analyzed as described in the materials and methods. Data points are represented as mean ± SEM (n = 3). *p ≤ 0.05, **p ≤ 0.001.
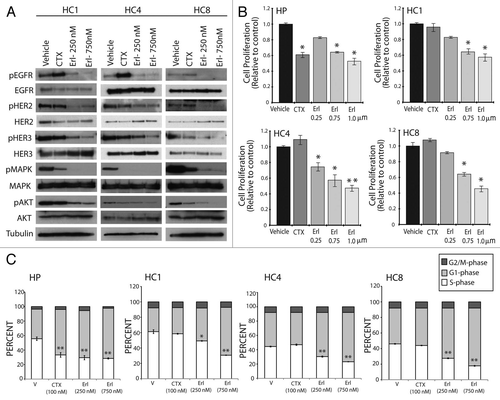
Figure 3 Erlotinib induces apoptosis in cells with acquired resistance to cetuximab. Parental cell line (HP) or cetuximab-resistant cell lines (HC1, HC4, HC8) were plated and allowed to adhere for 24 h prior to treatment with vehicle (DMSO), cetuximab (100 nM) or erlotinib (500 nM or 1 uM) for 48 h prior to Annexin-V analysis via flow cytometry. Annexin-V analysis was described in the materials and methods. Data points are represented as mean ± SEM (n = 3). *p ≤ 0.05, **p ≤ 0.001.
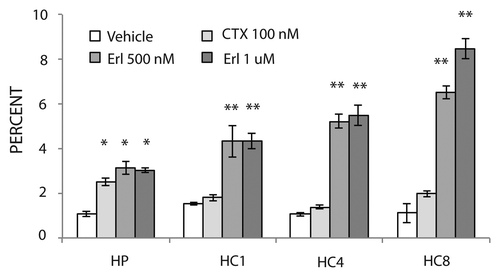
Figure 4 Erlotinib can delay growth of cetuximab-resistant tumors in vivo. Mice were injected with NCI-H226 and grown to 50–100 mm3. All mice were randomized to treatment or control groups and treated with either 0.5 mg/mouse (20 mg/kg) of cetuximab or IgG intraperitoneally twice per week. Tumors were monitored for cetuximab resistance that was defined as marked tumor growth in the presence of continued cetuximab therapy. Once cetuximab-resistant tumors reached a volume >500 mm3, mice were paired according to similar time points of resistance. At this point each mouse was taken off cetuximab and treated with either vehicle (■) or 70 mg/kg of erlotinib (◊), 5 d a week by oral gavage. The black arrow designates the starting time point of erlotinib or vehicle treatment. The average tumor volume of mice treated with IgG (▴) is included in all parts for comparison purposes.
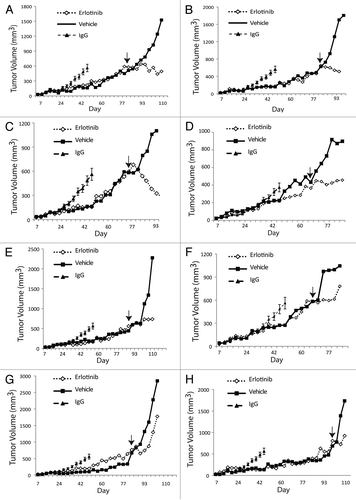
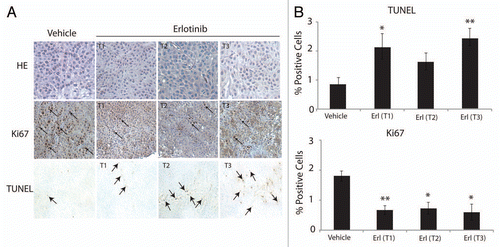
Figure 5 Erlotinib decreases proliferation and enhances apoptosis of cetuximab-resistant tumors. (A) Cetuximab-resistant tumor samples after treatment with either erlotinib (Ctx+Erl) or vehicle (Ctx+Veh) were prepared and analyzed for proliferation (Ki67) and apoptosis (TUNEL). Erlotinib treated cetuximab-resistant tumors are designated by T1, T2 and T3. The T1, T2 and vehicle treated cetuximab-resistant tumors were collected 3 h after final erlotinib treatment, and the T3 erlotinib treated cetuximab-resistant tumor was collected 6 h post final erlotinib treatment. Black arrows denote positive staining DNA on TUNEL part, and positive staining nuclei in Ki67 part. H&E stained sections (magnification, ×200). (B) Quantitation of IHC-positive staining for Ki67 and TUNEL stained tumor samples. Graph of the TUNEL (upper) and Ki67 (lower) expression as percentage of positive cells (five random fields, one section for each sample, *p ≤ 0.05, **p ≤ 0.001). ImageJ was used to quantify the positive staining.