Figures & data
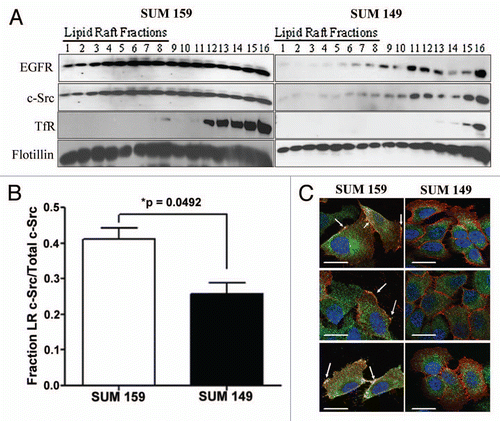
Figure 1 c-Src localizes within lipid rafts in SUM159 breast cancer cells. (A) SUM159 or SUM149 cells were plated and cultured for 72 h in normal growth media. Lipid rafts were separated by ultracentrifugation and immunoblotting was performed for EGFR, c-Src, transferrin receptor and flotillin. Lanes numbered 1–7 indicate lipid raft fractions (Macdonald and Pike, 2005). (B) Densitometry was performed on c-Src immunoblots from (A). Bars represent the percent of total c-Src in lipid raft fractions (1–7) compared with the total c-Src (fractions 1–14). Fractions 15 and 16 were excluded as pellet fractions. Experiments were repeated at least three independent times. p value was calculated by comparing the percent of c-Src in lipid rafts in SUM159 cells compared with SUM149 cells using the Student's t-test. (C) Two hundred thousand cells were plated onto coverslips and cultured under normal growth conditions for 48 h. Coverslips containing cells were then incubated with Alexa-fluor 594 labeled cholera toxin subunit B (red) to stain lipid rafts, fixed, permeabilized, blocked and then stained for c-Src utilizing 2–17 and an alexa-fluor 488 labeled secondary antibody (green). DAPI was used to stain the nucleus (blue). Imaging was performed using Zeiss Axioplan2 apotome microscope fitted with 63x 1.25 oil immersion lens at the Microscopy and Imaging Resources Laboratory (Wayne State University, Detroit, MI). Arrows represent lipid raft localized c-Src. Three representative images from three distinct experiments are shown.

Figure 2 EGFR and c-Src co-localize and co-associate within lipid rafts. (A) Two hundred thousand cells were plated onto coverslips and cultured under normal growth conditions for 48 h. Coverslips containing cells were blocked, and then incubated with fluorphore-labeled antibodies (EGFR-488: green; Src-594: red). The nucleus was stained with DAPI (blue). Imaging was performed using Zeiss Axioplan2 apotome microscope fitted with 63X 1.25 oil immersion lens at the Microscopy and Imaging Resources Laboratory (Wayne State University, Detroit, MI). Arrows indicate areas of co-localization at the plasma membrane (yellow). (B and C) SUM159 cells were plated, allowed to grow for 48 h, and then lysed. Five hundred micrograms of protein was immunoprecipitated with EGFR antibodies (B) or c-Src antibodies (C), then subjected to SDS-PAGE and immunoblotting for EGFR and c-Src. Ten micrograms (2% input) of whole cell lysate (WCL) was utilized as a positive control and mouse IgG immunoprecipitation was performed as a negative control (IgG). (D) Lipid rafts were isolated from SUM159 cells by biochemical raft isolation as described. Two hundred microliters of each fraction [Lipid raft fractions 1–7 (LR) or Non-lipid raft fractions 8–14 (NR)] was pooled (approximately 100 ug), and EGFR or c-Src was immunoprecipitated. Immunoblotting was then performed for EGFR and c-Src. Ten micrograms of whole cell lysate (WCL, 10% input) was utilized as a positive control, while immunoprecipitation with IgG was utilized as a negative control. Arrows indicate the c-Src band. Immunoblots were performed at least three independent times. (E) Cells were treated with 1 mM MBCD for 1 h. Lysates were prepared and 500 µg of protein were immunoprecipitated using EGFR antibodies. Immunoprecipitates were separated by SDS-PAGE and immunoblotted using EGFR and c-Src antibodies.
![Figure 2 EGFR and c-Src co-localize and co-associate within lipid rafts. (A) Two hundred thousand cells were plated onto coverslips and cultured under normal growth conditions for 48 h. Coverslips containing cells were blocked, and then incubated with fluorphore-labeled antibodies (EGFR-488: green; Src-594: red). The nucleus was stained with DAPI (blue). Imaging was performed using Zeiss Axioplan2 apotome microscope fitted with 63X 1.25 oil immersion lens at the Microscopy and Imaging Resources Laboratory (Wayne State University, Detroit, MI). Arrows indicate areas of co-localization at the plasma membrane (yellow). (B and C) SUM159 cells were plated, allowed to grow for 48 h, and then lysed. Five hundred micrograms of protein was immunoprecipitated with EGFR antibodies (B) or c-Src antibodies (C), then subjected to SDS-PAGE and immunoblotting for EGFR and c-Src. Ten micrograms (2% input) of whole cell lysate (WCL) was utilized as a positive control and mouse IgG immunoprecipitation was performed as a negative control (IgG). (D) Lipid rafts were isolated from SUM159 cells by biochemical raft isolation as described. Two hundred microliters of each fraction [Lipid raft fractions 1–7 (LR) or Non-lipid raft fractions 8–14 (NR)] was pooled (approximately 100 ug), and EGFR or c-Src was immunoprecipitated. Immunoblotting was then performed for EGFR and c-Src. Ten micrograms of whole cell lysate (WCL, 10% input) was utilized as a positive control, while immunoprecipitation with IgG was utilized as a negative control. Arrows indicate the c-Src band. Immunoblots were performed at least three independent times. (E) Cells were treated with 1 mM MBCD for 1 h. Lysates were prepared and 500 µg of protein were immunoprecipitated using EGFR antibodies. Immunoprecipitates were separated by SDS-PAGE and immunoblotted using EGFR and c-Src antibodies.](/cms/asset/11dd4278-27ab-4647-9e77-f89c8af262ea/kcbt_a_10916907_f0002.gif)
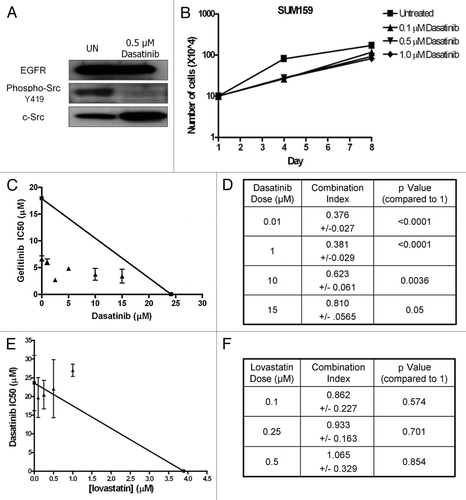
Figure 3 Dasatinib sensitizes SUM159 cells to gefitinib, but not lovastatin. (A) SUM159 cells were treated with 0.5 uM dasatinib for 2 h and lysates were subjected to SDS-PAGE followed by immunoblotting for EGFR, c-Src and phospho-Y416 c-Src. (B) SUM159 cells were plated in 35 mm plates and grown for eight days. Treatment with the indicated doses of dasatinib occurred every other day and cell counts were performed on days 1, 4 and 8. Error bars represent average of three independent experiments performed in triplicate. (C) SUM159 cells were plated in a 96-well plate and treated with increasing doses of dasatinib and gefitinib for 72 h. Cell viability was measured using MTS assays. The IC50 of gefitinib at each dose of dasatinib was calculated and plotted on an isobologram. (D) The combination index (CI-value) was calculated as follows: (IC50 gefitinib at × dose of dasatinib)/(IC50 gefitinib alone) + (dose of dasatinib)/(IC50 dasatinib alone). (E) Cells were placed in a 96-well plate and treated with variable doses of dasatinib and lovastatin for 72 h. Cell viability was measured using MTS assays. The IC50 of dasatinib at each dose of lovastatin was calculated and plotted on an isobologram. (F) The CI-value was calculated and the p value was determined as compared with 1. All experiments were performed at least three independent times. p values were calculated as a difference between CI-values and one utilizing the Student's t-test.

Figure 4 Phosphorylation of Akt is c-Src kinase-dependent in SUM159 cells. (A) Biochemical raft isolation was performed as described on SUM159 and SUM149 cells. Fractions were separated by SDS-PAGE and immunblotting for p110α, transferrin receptor and flotillin was performed. Blots are representative of at least three independent experiments. (B) Whole cell lysates were collected from SUM159 cells treated with 1.0 µM gefitinib and 1.0 µM dasatinib alone or in combination. Expression and phosphorylation of Akt and MAPK, as well as expression of EGFR was determined by immunoblotting. Immunoblots were repeated at least three independent times.
