1,685
Views
28
CrossRef citations to date
0
Altmetric
Research Paper

Pharmacologic synergy between dual phosphoinositide-3-kinase and mammalian target of rapamycin inhibition and 5-Fluorouracil in PIK3CA mutant gastric cancer cells

, , , , , & show all
Pages 34-42 | Received 07 Jul 2011, Accepted 16 Oct 2011, Published online: 01 Jan 2012

Figures & data

Table 1. IC50 values of 5-FU, PI103, and rapamycin, and combination index values of PI103 and 5-FU in gastric cancer cells

Figure 1. Effect of PI103, 5-FU and combination on apoptosis induction in gastric cancer cell lines. Nucleosome formation values are displayed as mean ± SD (n = 3) relative to values in untreated control cells. *p < 0.01 compared with controls.
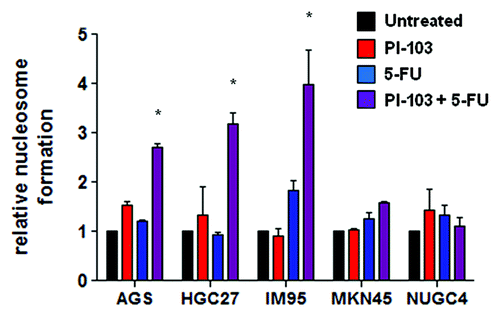
Figure 1. Effect of PI103, 5-FU and combination on apoptosis induction in gastric cancer cell lines. Nucleosome formation values are displayed as mean ± SD (n = 3) relative to values in untreated control cells. *p < 0.01 compared with controls.

Figure 2. Effect of PI103, 5-FU and the combination on protein expression of E2F1, TS, the PI3K/mTOR pathway, and DNA damage in AGS (A), HGC27 (B), IM95 (C), MKN45 (D) and NUGC4 (E) gastric cancer cells. Cells were exposed to 1x and 3x IC50 concentrations of PI103 and 5-FU, and the combination of PI103 and 5-FU (at IC50 levels, denoted with +) for 24 h, and lysates immunoblotted as described in the Methods section. GAPDH was used as a loading control. A representative image of two independent blots, each using independently prepared cell lysates, is displayed.
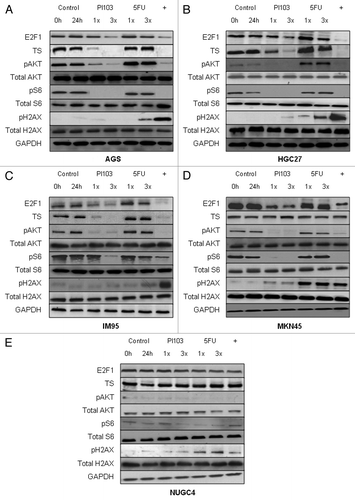
Figure 2. Effect of PI103, 5-FU and the combination on protein expression of E2F1, TS, the PI3K/mTOR pathway, and DNA damage in AGS (A), HGC27 (B), IM95 (C), MKN45 (D) and NUGC4 (E) gastric cancer cells. Cells were exposed to 1x and 3x IC50 concentrations of PI103 and 5-FU, and the combination of PI103 and 5-FU (at IC50 levels, denoted with +) for 24 h, and lysates immunoblotted as described in the Methods section. GAPDH was used as a loading control. A representative image of two independent blots, each using independently prepared cell lysates, is displayed.

Figure 3. (A) Effect of E2F1 siRNA (red) on 5-FU cytotoxicity in gastric cancer cells. (B) Effect of non-growth inhibitory concentration of rapamycin (blue) on 5-FU cytotoxicity in gastric cancer cells. (C) Effect of PIK3CA siRNA (red) on 5-FU cytotoxicity in gastric cancer cells. Charts display mean (± SD) proportion of cells in three independent experiments.
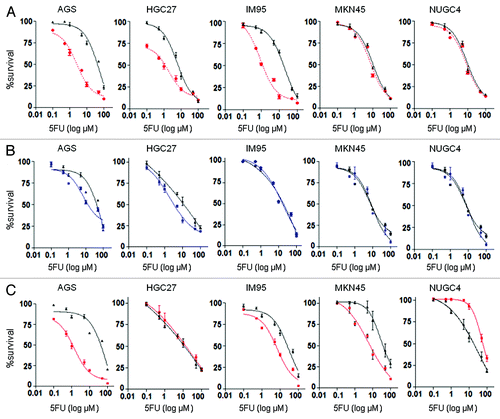
Figure 3. (A) Effect of E2F1 siRNA (red) on 5-FU cytotoxicity in gastric cancer cells. (B) Effect of non-growth inhibitory concentration of rapamycin (blue) on 5-FU cytotoxicity in gastric cancer cells. (C) Effect of PIK3CA siRNA (red) on 5-FU cytotoxicity in gastric cancer cells. Charts display mean (± SD) proportion of cells in three independent experiments.

Table 2. Effect of exogenous thymidine on PI103 and 5-FU combination

Figure 4. Evaluation of non-growth inhibitory concentration of rapamycin (rapa) and PIK3CA siRNA on 5-FU sensitivity in AGS (A) and HGC27 (B) cells. Charts display mean (± SD) proportion of cells in three independent experiments. NTC, non-treated control.
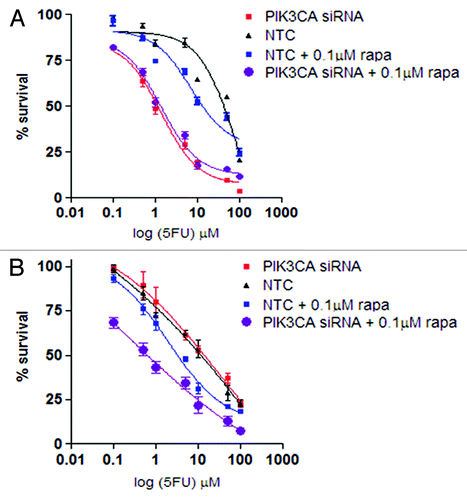
Figure 4. Evaluation of non-growth inhibitory concentration of rapamycin (rapa) and PIK3CA siRNA on 5-FU sensitivity in AGS (A) and HGC27 (B) cells. Charts display mean (± SD) proportion of cells in three independent experiments. NTC, non-treated control.

Figure 5. (A) Tumor sizes of mouse xenograft models of HGC27 cells treated with PI103, 5-FU, the combination and control (10% DMSO). The chart displays mean (± SD) size of tumors (n = 3). (B) Western immunoblot showing effect of PI103, 5-FU and the combination on levels of E2F1, TS, the PI3K/mTOR pathway proteins and H2AX in HGC27 xenograft tumor samples. A representative of two independent blots from independently prepared tissue homogenates is displayed.
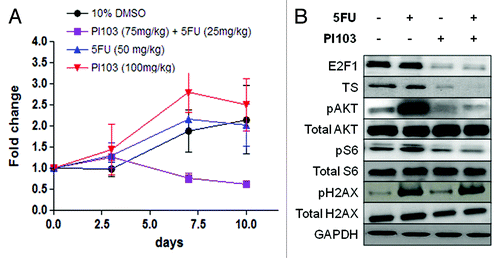
Figure 5. (A) Tumor sizes of mouse xenograft models of HGC27 cells treated with PI103, 5-FU, the combination and control (10% DMSO). The chart displays mean (± SD) size of tumors (n = 3). (B) Western immunoblot showing effect of PI103, 5-FU and the combination on levels of E2F1, TS, the PI3K/mTOR pathway proteins and H2AX in HGC27 xenograft tumor samples. A representative of two independent blots from independently prepared tissue homogenates is displayed.
Supplemental material

Additional material

Download Zip (177.9 KB)

Reprints and Corporate Permissions

Please note: Selecting permissions does not provide access to the full text of the article, please see our help page How do I view content?

To request a reprint or corporate permissions for this article, please click on the relevant link below:

Academic Permissions

Please note: Selecting permissions does not provide access to the full text of the article, please see our help page How do I view content?

Obtain permissions instantly via Rightslink by clicking on the button below:

If you are unable to obtain permissions via Rightslink, please complete and submit this Permissions form. For more information, please visit our Permissions help page.