760
Views
11
CrossRef citations to date
0
Altmetric
Research Paper

A single nucleotide polymorphism of the cholecystokinin-B receptor predicts risk for pancreatic cancer

, , , , , , , , & show all
Pages 164-174 | Received 06 Oct 2011, Accepted 07 Nov 2011, Published online: 01 Feb 2012

Figures & data

Figure 1 Specificity of the CCKCR antibody. (A) Protein gel blot with protein extracts of HEK-293 cells that were transiently transfected with pcDNA3.1 (vector-only) or 6xHis epitope-tagged receptor cDNA for the CCKBR or the CCKCR (left panel). Both CCKBR and CCKCR extracts react to the 6xHis antibody whereas the vector-extract only does not. The same HEK-293 cell extracts were reacted with the monoclonal antibody specific to the CCKCR (right panel). Only the cells expressing the CCKCR demonstrated reactivity whereas the antibody did not cross react with the cells expressing only the CCKBR. (B) COS1 cells transiently transfected with either the cDNA for the CCKCR or the CCKBR are shown. The CCKCR antibody shows specificity to the cells expressing this receptor whereas the anti-CCKBR antibody reacts to both the CCKCR and the CCKBR cells.
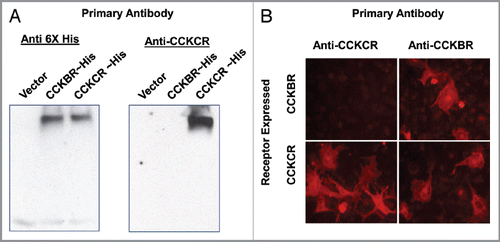
Figure 1 Specificity of the CCKCR antibody. (A) Protein gel blot with protein extracts of HEK-293 cells that were transiently transfected with pcDNA3.1 (vector-only) or 6xHis epitope-tagged receptor cDNA for the CCKBR or the CCKCR (left panel). Both CCKBR and CCKCR extracts react to the 6xHis antibody whereas the vector-extract only does not. The same HEK-293 cell extracts were reacted with the monoclonal antibody specific to the CCKCR (right panel). Only the cells expressing the CCKCR demonstrated reactivity whereas the antibody did not cross react with the cells expressing only the CCKBR. (B) COS1 cells transiently transfected with either the cDNA for the CCKCR or the CCKBR are shown. The CCKCR antibody shows specificity to the cells expressing this receptor whereas the anti-CCKBR antibody reacts to both the CCKCR and the CCKBR cells.

Figure 2 Localization of the CCKCR. (A) Confocal micrograph image of permeabilized CCKCR expressing cells reacted with the CCKCR monoclonal antibody and an Alexafluor-488 labeled anti-mouse secondary antibody showing the binding to the cytoplasmic membrane. (B) The same cells that are not permeabilized lack immunoreactivity. Nuclei are visualized with DAPI. (C) An electronmicrograph (EM) image of the CCKCR monoclonal antibody in a CCKCR expressing pancreatic cancer cell with secondary gold labeling, shows the receptor location to intracytoplasmic membrane. (D) EM image of CCKCR positive cells reacted with the secondary antibody only (negative control).
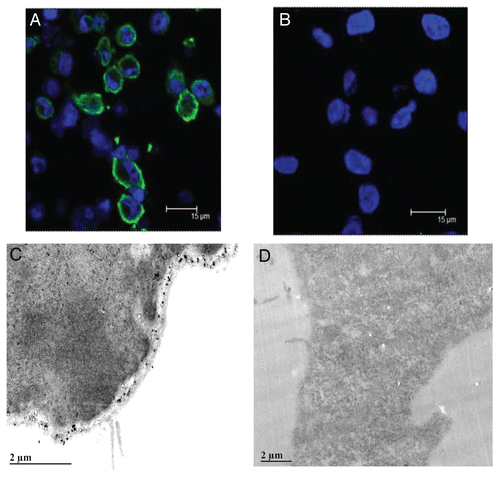
Figure 2 Localization of the CCKCR. (A) Confocal micrograph image of permeabilized CCKCR expressing cells reacted with the CCKCR monoclonal antibody and an Alexafluor-488 labeled anti-mouse secondary antibody showing the binding to the cytoplasmic membrane. (B) The same cells that are not permeabilized lack immunoreactivity. Nuclei are visualized with DAPI. (C) An electronmicrograph (EM) image of the CCKCR monoclonal antibody in a CCKCR expressing pancreatic cancer cell with secondary gold labeling, shows the receptor location to intracytoplasmic membrane. (D) EM image of CCKCR positive cells reacted with the secondary antibody only (negative control).

Figure 3 CCKCR phenotype is associated with the presence of the SNP A/A or A/C genotype. (A) CCKCR immunoreactivity is found in malignant cells of a pancreatic cancer of a patient having genotype A/A. CCKCR immunoreactivity is identified in a nerve invaded by cancer cells (arrow). The surrounding connective tissue (*CT) is void of CCKCR staining. (B) CCKCR positive immunoreactivity is seen from a pancreatic tumor of a patient with genotype A/C (arrows point to cancer cells). Again note the fibrous connective tissue surrounding the cancer cells is void of receptors. (C) A pancreatic cancer specimen from a subject with genotype C/C shows lack of CCKCR immunoreactivity. Arrow is pointing to malignant glands where cancer cells do not have the CCKCR. (D) A tissue specimen from a procured normal pancreas with genotype A/A showing the lack of CCKCR immunoreactivity in normal benign tissue. (E) PANC-1 cancer cells which have the A/C genotype show immunoreactivity to the CCKCR antibody by confocal microscopy. (F) AsPC-1 pancreatic cancer cells which have the C/C genotype do not react with the CCKCR antibody. Nuclei are stained with DAPI.
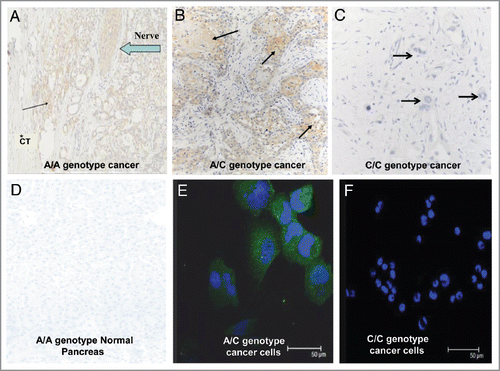
Figure 3 CCKCR phenotype is associated with the presence of the SNP A/A or A/C genotype. (A) CCKCR immunoreactivity is found in malignant cells of a pancreatic cancer of a patient having genotype A/A. CCKCR immunoreactivity is identified in a nerve invaded by cancer cells (arrow). The surrounding connective tissue (*CT) is void of CCKCR staining. (B) CCKCR positive immunoreactivity is seen from a pancreatic tumor of a patient with genotype A/C (arrows point to cancer cells). Again note the fibrous connective tissue surrounding the cancer cells is void of receptors. (C) A pancreatic cancer specimen from a subject with genotype C/C shows lack of CCKCR immunoreactivity. Arrow is pointing to malignant glands where cancer cells do not have the CCKCR. (D) A tissue specimen from a procured normal pancreas with genotype A/A showing the lack of CCKCR immunoreactivity in normal benign tissue. (E) PANC-1 cancer cells which have the A/C genotype show immunoreactivity to the CCKCR antibody by confocal microscopy. (F) AsPC-1 pancreatic cancer cells which have the C/C genotype do not react with the CCKCR antibody. Nuclei are stained with DAPI.

Figure 4 The SNP genotype correlates with survival. Kaplan Meier survival curve shows significantly prolonged survival in patients with pancreatic cancer who have the C/C genotype compared with those with either the A/A or the A/C genotype (p = 0.0001). Patients still alive at the last censored date is shown by a + on the survival curve. The number of patients surviving at different time intervals is displayed below the curve.
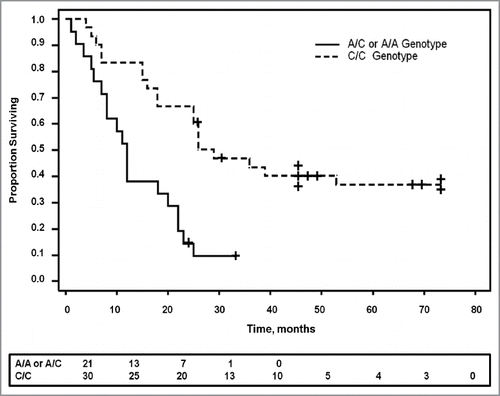
Figure 4 The SNP genotype correlates with survival. Kaplan Meier survival curve shows significantly prolonged survival in patients with pancreatic cancer who have the C/C genotype compared with those with either the A/A or the A/C genotype (p = 0.0001). Patients still alive at the last censored date is shown by a + on the survival curve. The number of patients surviving at different time intervals is displayed below the curve.

Figure 5 Overexpression of the CCKCR and not CCKBR in pancreatic cancer cells stimulates growth. (A) MTS cell growth assay was performed in AsPC-1 wild type C/C cells, vector transfected AsPC-1 cells, or AsPC-1 cells transfected to overexpress the either the CCKBR or CCKCR. Growth was significantly increased in the CCKCR over-expressing cancer cells compared with vector and wild type controls and also compared with CCKBR overexpressing cells suggesting that the CCKCR receptor expression provides a growth benefit to the cancer (***p = 2.7 x 10⁻¹¹). The assay was performed after 48 h of growth and done three times. (B) BrdU incorporation was also assessed with AsPC-1 wild-type, vector transfected, CCKBR or CCKCR transfected cells. BrdU incorporation was markedly increased (***p = 5.8 x 10⁻⁷) in CCKCR transfected cancer cells compared with control cells.
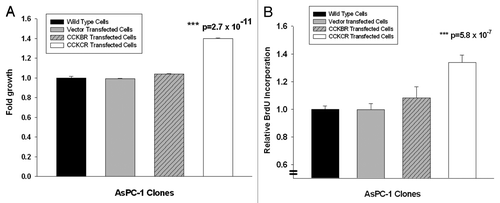
Figure 5 Overexpression of the CCKCR and not CCKBR in pancreatic cancer cells stimulates growth. (A) MTS cell growth assay was performed in AsPC-1 wild type C/C cells, vector transfected AsPC-1 cells, or AsPC-1 cells transfected to overexpress the either the CCKBR or CCKCR. Growth was significantly increased in the CCKCR over-expressing cancer cells compared with vector and wild type controls and also compared with CCKBR overexpressing cells suggesting that the CCKCR receptor expression provides a growth benefit to the cancer (***p = 2.7 x 10⁻¹¹). The assay was performed after 48 h of growth and done three times. (B) BrdU incorporation was also assessed with AsPC-1 wild-type, vector transfected, CCKBR or CCKCR transfected cells. BrdU incorporation was markedly increased (***p = 5.8 x 10⁻⁷) in CCKCR transfected cancer cells compared with control cells.

Figure 6 Overexpression of the CCK-CR in human pancreatic cancer cells is confirmed by flow cytometry. Overexpressing cancer cells were reacted with either no antibody for background control (A) or with a nonspecific IgG antibody control (B). Cancer cells that overexpress the CCKCR show increased immunoreactivity to the selective CCKCR monoclonal antibody (C). AB, antibody; mAB, monoclonal antibody.
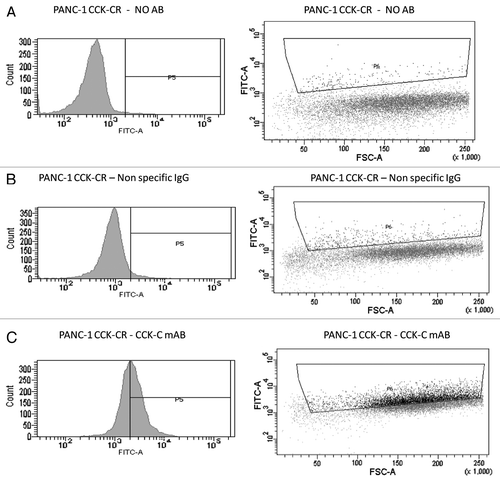
Figure 6 Overexpression of the CCK-CR in human pancreatic cancer cells is confirmed by flow cytometry. Overexpressing cancer cells were reacted with either no antibody for background control (A) or with a nonspecific IgG antibody control (B). Cancer cells that overexpress the CCKCR show increased immunoreactivity to the selective CCKCR monoclonal antibody (C). AB, antibody; mAB, monoclonal antibody.

Table 1 Genotype frequency according to histology

Table 2 Patient and tumor characteristics as predictors of survival

Reprints and Corporate Permissions

Please note: Selecting permissions does not provide access to the full text of the article, please see our help page How do I view content?

To request a reprint or corporate permissions for this article, please click on the relevant link below:

Academic Permissions

Please note: Selecting permissions does not provide access to the full text of the article, please see our help page How do I view content?

Obtain permissions instantly via Rightslink by clicking on the button below:

If you are unable to obtain permissions via Rightslink, please complete and submit this Permissions form. For more information, please visit our Permissions help page.