1,451
Views
24
CrossRef citations to date
0
Altmetric
Research Paper

HIPK2 downregulates vimentin and inhibits breast cancer cell invasion

, , , , , , , , & show all
Pages 198-205 | Received 04 Aug 2011, Accepted 07 Nov 2011, Published online: 15 Feb 2012

Figures & data

Figure 1. mRNA expression of vimentin and E-cadherin in breast cancer cells after HIPK2 overexpression. (A) Semi-quantitative RT-PCR analysis of vimentin and E-cadherin in MCF7 and MDA-MB-231 cells. 28S mRNA levels were detected as control of cDNA inputs. (B) MDA-MB-231 cells were transfected with HIPK2 expression vector and vimentin and E-cadherin mRNA levels were detected 24 h after transfection. HIPK2 mRNA levels are indicative of HIPK2 overexpression. 28S mRNA levels were detected as control of cDNA inputs.
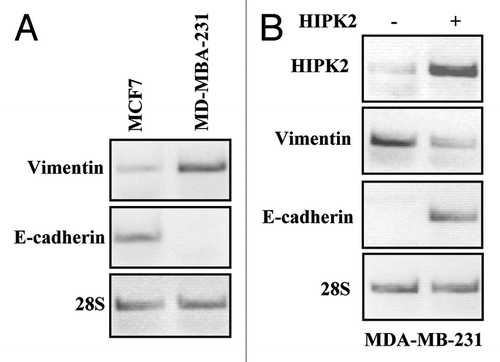
Figure 1. mRNA expression of vimentin and E-cadherin in breast cancer cells after HIPK2 overexpression. (A) Semi-quantitative RT-PCR analysis of vimentin and E-cadherin in MCF7 and MDA-MB-231 cells. 28S mRNA levels were detected as control of cDNA inputs. (B) MDA-MB-231 cells were transfected with HIPK2 expression vector and vimentin and E-cadherin mRNA levels were detected 24 h after transfection. HIPK2 mRNA levels are indicative of HIPK2 overexpression. 28S mRNA levels were detected as control of cDNA inputs.

Figure 2. Regulation of vimentin transcription by HIPK2. (A) H1299 cells were co-transfected with the vimentin-luciferase reporter plasmid together with HIPK2, kinase-deficient K221R mutant, or empty vector (Ctr). Luciferase activity was measured 36 h after transfection. Results, normalized to β-gal activity, are the mean of seven independent experiments, performed in duplicate, ± SD. RLU, relative luciferase units. *p < 0.0001. (B) ChIP analysis with anti-HIPK2 and anti-HDAC1 antibodies or no antibody as control was performed in MDA-MB-231 cells transfected with HIPK2 expression vector or empty vector (Ctr) for 24 h. Co-recruitment of HIPK2 and HDAC1 onto the vimentin promoter was detected by RT-PCR, and analyzed by densitometry. Relative enrichment of HIPK2 and HDAC1 onto vimentin promoter, compared with no antibody, is shown. Amplification of the GAPDH promoter was used as control of HIPK2 binding specificity to the vimentin promoter. The data represent the mean of two independent experiments ± SD (C) MDA-MB-231 cells were transfected with HIPK2 and K22R expression vector and equal amount of total cell extracts were analyzed by protein gel immunoblotting with anti-vimentin antibody. Hsp70 detection was used as protein loading control.
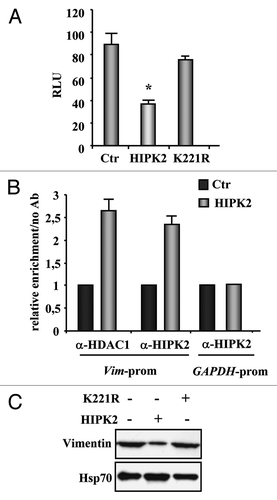
Figure 2. Regulation of vimentin transcription by HIPK2. (A) H1299 cells were co-transfected with the vimentin-luciferase reporter plasmid together with HIPK2, kinase-deficient K221R mutant, or empty vector (Ctr). Luciferase activity was measured 36 h after transfection. Results, normalized to β-gal activity, are the mean of seven independent experiments, performed in duplicate, ± SD. RLU, relative luciferase units. *p < 0.0001. (B) ChIP analysis with anti-HIPK2 and anti-HDAC1 antibodies or no antibody as control was performed in MDA-MB-231 cells transfected with HIPK2 expression vector or empty vector (Ctr) for 24 h. Co-recruitment of HIPK2 and HDAC1 onto the vimentin promoter was detected by RT-PCR, and analyzed by densitometry. Relative enrichment of HIPK2 and HDAC1 onto vimentin promoter, compared with no antibody, is shown. Amplification of the GAPDH promoter was used as control of HIPK2 binding specificity to the vimentin promoter. The data represent the mean of two independent experiments ± SD (C) MDA-MB-231 cells were transfected with HIPK2 and K22R expression vector and equal amount of total cell extracts were analyzed by protein gel immunoblotting with anti-vimentin antibody. Hsp70 detection was used as protein loading control.
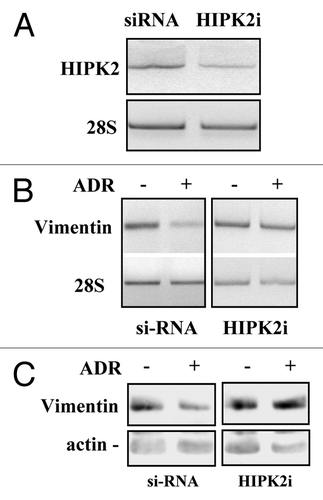
Figure 3. HIPK2 knock-down impairs the ADR-induced vimentin downregulation. (A) MDA-MB-231 cells were transfected with the control (siRNA) or specific HIPK2 interfering vector (HIPK2i) and 36 h after transfection mRNA was extracted for semi-quantitative RT-PCR analysis of HIPK2 levels. 28S mRNA levels were detected as control of cDNA inputs. (B) MDA-MB-231 control or HIPK2-interfered cells as in (A) were treated with ADR (1.5 μg/ml) and for 12 h after treatment mRNA was extracted for semi-quantitative RT-PCR analysis of vimentin levels. 28S mRNA levels were detected as control of cDNA inputs. (C) MDA-MB-231 control or HIPK2-interfered cells were treated as in (B) equal amount of total cell extracts were analyzed by protein gel immunoblotting with anti-vimentin antibody. Hsp70 detection was used as protein loading control.

Figure 3. HIPK2 knock-down impairs the ADR-induced vimentin downregulation. (A) MDA-MB-231 cells were transfected with the control (siRNA) or specific HIPK2 interfering vector (HIPK2i) and 36 h after transfection mRNA was extracted for semi-quantitative RT-PCR analysis of HIPK2 levels. 28S mRNA levels were detected as control of cDNA inputs. (B) MDA-MB-231 control or HIPK2-interfered cells as in (A) were treated with ADR (1.5 μg/ml) and for 12 h after treatment mRNA was extracted for semi-quantitative RT-PCR analysis of vimentin levels. 28S mRNA levels were detected as control of cDNA inputs. (C) MDA-MB-231 control or HIPK2-interfered cells were treated as in (B) equal amount of total cell extracts were analyzed by protein gel immunoblotting with anti-vimentin antibody. Hsp70 detection was used as protein loading control.

Figure 4. HIPK2 overexpression inhibits MDA-MB-231 cell invasion. (A) The highly invasive MDA-MB-231 cell line was transfected with HIPK2 expression vector and 24 h after transfection both floating and adherent cells were collected and cell proliferation (left panel) and viability (right panel) were determined by Trypan blue exclusion. The results are the mean of three independent experiment ± S.D. (B) MDA-MB-231 cells were transfected with HIPK2 expression vector (+) or empty vector (-). Sixteen hours after transfection, cells were serum-starved (2% FBS) for 24 h and cell invasion was measured using a Boyden’s chamber invasion assay. Mean invaded cells/microscopic field, ± S.D., is shown. *p < 0.0001.
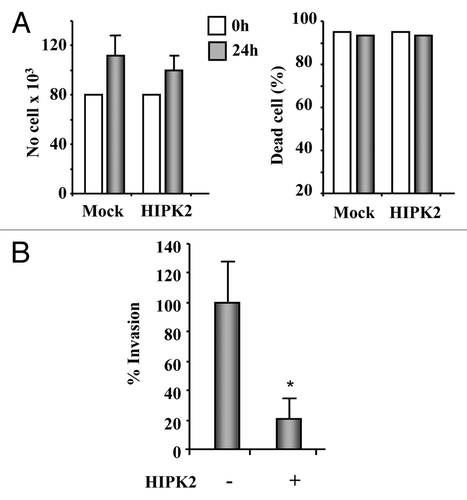
Figure 4. HIPK2 overexpression inhibits MDA-MB-231 cell invasion. (A) The highly invasive MDA-MB-231 cell line was transfected with HIPK2 expression vector and 24 h after transfection both floating and adherent cells were collected and cell proliferation (left panel) and viability (right panel) were determined by Trypan blue exclusion. The results are the mean of three independent experiment ± S.D. (B) MDA-MB-231 cells were transfected with HIPK2 expression vector (+) or empty vector (-). Sixteen hours after transfection, cells were serum-starved (2% FBS) for 24 h and cell invasion was measured using a Boyden’s chamber invasion assay. Mean invaded cells/microscopic field, ± S.D., is shown. *p < 0.0001.

Figure 5. Chemical hypoxia induces vimentin expression and cell migration in MCF7 cells that may be reverted by HIPK2 overexpression. (A) MCF7 cells were co-transfected with the vimentin-luciferase reporter plasmid together with HIPK2, K221R mutant or empty vector. Sixteen hours after transfection, cells were treated with CoCl2 (200 µM). Luciferase activity was measured 24 h after treatment. Results, normalized to β-gal activity, are the mean of three independent experiments, performed in duplicate, ± S.D. RLU: Realtive Luciferase Units. (B) Semi-quantitative RT-PCR analysis of vimentin mRNA in MCF7 treated as in (A). Results are shown as the ratio between vimentin and 28S mRNA levels, as measured by densitometric analysis. (C) The low invasive MCF7 cell line was transfected with HIPK2 or K221R expression vectors empty vector. Sixteen hours after transfection, cells were treated with CoCl2 (200 µM) and 24 h later serum-starved (2% FBS) for additional 24 h. Cell invasion was measured using a Boyden’s chamber invasion assay. Mean invaded cells/microscopic field, ± S.D., is shown. *p < 0.007, **p < 0.0003.

Figure 5. Chemical hypoxia induces vimentin expression and cell migration in MCF7 cells that may be reverted by HIPK2 overexpression. (A) MCF7 cells were co-transfected with the vimentin-luciferase reporter plasmid together with HIPK2, K221R mutant or empty vector. Sixteen hours after transfection, cells were treated with CoCl2 (200 µM). Luciferase activity was measured 24 h after treatment. Results, normalized to β-gal activity, are the mean of three independent experiments, performed in duplicate, ± S.D. RLU: Realtive Luciferase Units. (B) Semi-quantitative RT-PCR analysis of vimentin mRNA in MCF7 treated as in (A). Results are shown as the ratio between vimentin and 28S mRNA levels, as measured by densitometric analysis. (C) The low invasive MCF7 cell line was transfected with HIPK2 or K221R expression vectors empty vector. Sixteen hours after transfection, cells were treated with CoCl2 (200 µM) and 24 h later serum-starved (2% FBS) for additional 24 h. Cell invasion was measured using a Boyden’s chamber invasion assay. Mean invaded cells/microscopic field, ± S.D., is shown. *p < 0.007, **p < 0.0003.
Supplemental material

Additional material

Download Zip (145 KB)

Reprints and Corporate Permissions

Please note: Selecting permissions does not provide access to the full text of the article, please see our help page How do I view content?

To request a reprint or corporate permissions for this article, please click on the relevant link below:

Academic Permissions

Please note: Selecting permissions does not provide access to the full text of the article, please see our help page How do I view content?

Obtain permissions instantly via Rightslink by clicking on the button below:

If you are unable to obtain permissions via Rightslink, please complete and submit this Permissions form. For more information, please visit our Permissions help page.