1,388
Views
69
CrossRef citations to date
0
Altmetric
Research Paper

MiR-135a targets JAK2 and inhibits gastric cancer cell proliferation

, , , , &
Pages 281-288 | Received 06 Oct 2011, Accepted 02 Dec 2011, Published online: 01 Mar 2012

Figures & data

Figure 1. MiR-135a is downregulated in human gastric cancer. Quantitative real-time PCR for miR-135a was performed in 11 human gastric cancer surgical specimens and the matched adjacent non-tumor mucosal tissue. (A) The relative expression levels of miR-135a in individual gastric cancer samples expressed relative to the matched adjacent non-tumor tissue, miR-135a was downregulated in 8/11 (73%) of the tumor samples. (B) The mean ± SEM relative expression level of miR-135a in gastric cancer and non-tumor samples (*p < 0.01).
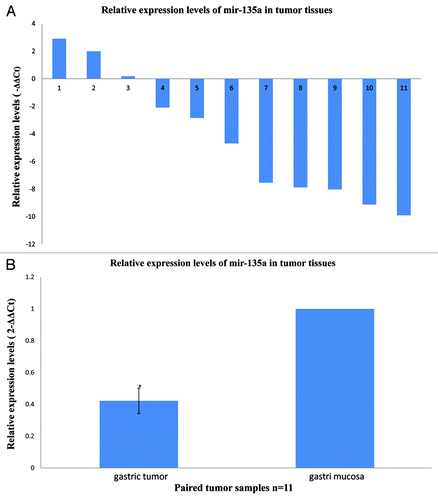
Figure 1. MiR-135a is downregulated in human gastric cancer. Quantitative real-time PCR for miR-135a was performed in 11 human gastric cancer surgical specimens and the matched adjacent non-tumor mucosal tissue. (A) The relative expression levels of miR-135a in individual gastric cancer samples expressed relative to the matched adjacent non-tumor tissue, miR-135a was downregulated in 8/11 (73%) of the tumor samples. (B) The mean ± SEM relative expression level of miR-135a in gastric cancer and non-tumor samples (*p < 0.01).

Figure 2. MiR-135a is downregulated in malignant gastric cancer cell lines. Real-time quantification of miR-135a using stem-loop RT-PCR in a variety of malignant gastric cancer cell lines and the nonmalignant gastric mucosa cell line GES-1. Expression of miR-135a was normalized to U6 snRNA and expressed relative to GES-1 cells. Values are mean ± SEM of triplicate experiments; **p < 0.01, *p < 0.05.
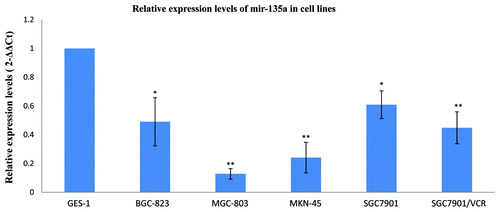
Figure 2. MiR-135a is downregulated in malignant gastric cancer cell lines. Real-time quantification of miR-135a using stem-loop RT-PCR in a variety of malignant gastric cancer cell lines and the nonmalignant gastric mucosa cell line GES-1. Expression of miR-135a was normalized to U6 snRNA and expressed relative to GES-1 cells. Values are mean ± SEM of triplicate experiments; **p < 0.01, *p < 0.05.

Figure 3. MiR-135a targets JAK2. (A, B) western blot of MGC-803 and BGC-823 cells transfected with the 40 nM miR-135a mimic or the negative control mimic at two time points. GAPDH was used as a loading control. (C, D) RT-PCR of JAK2 in MGC-803 and BGC-823 cells transfected with 40 nM miR-135a mimic or negative control mimic at two time points. GAPDH was used as a control.
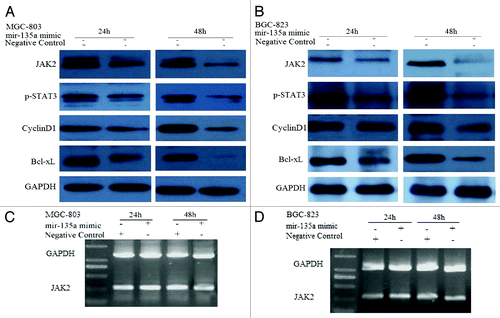
Figure 3. MiR-135a targets JAK2. (A, B) western blot of MGC-803 and BGC-823 cells transfected with the 40 nM miR-135a mimic or the negative control mimic at two time points. GAPDH was used as a loading control. (C, D) RT-PCR of JAK2 in MGC-803 and BGC-823 cells transfected with 40 nM miR-135a mimic or negative control mimic at two time points. GAPDH was used as a control.

Figure 4. Overexpression of miR-135a inhibits the proliferation of gastric cancer cells in vitro. (A, B) Phase contrast microscopy analysis of MGC-803 cells (A) and BGC-823 cells (B) 48 h post-transfection with 40 nM miR-135a mimic, 40 nM negative control mimic and untransfected control cells; (C, D) MTT assay of MGC-803 cells (C) and BGC-823 cells (D) 24, 48 and 72 h post-transfection with 40 nM miR-135a mimic, 40 nM negative control mimic and untransfected control cells. Data are mean ± SEM of three independent experiments; *p < 0.05 compared with the negative control mimic.
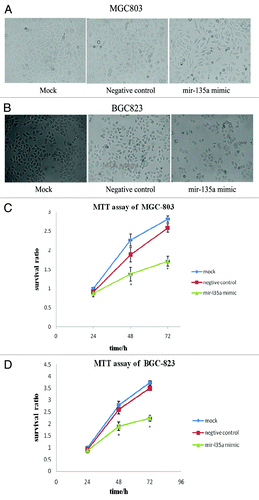
Figure 4. Overexpression of miR-135a inhibits the proliferation of gastric cancer cells in vitro. (A, B) Phase contrast microscopy analysis of MGC-803 cells (A) and BGC-823 cells (B) 48 h post-transfection with 40 nM miR-135a mimic, 40 nM negative control mimic and untransfected control cells; (C, D) MTT assay of MGC-803 cells (C) and BGC-823 cells (D) 24, 48 and 72 h post-transfection with 40 nM miR-135a mimic, 40 nM negative control mimic and untransfected control cells. Data are mean ± SEM of three independent experiments; *p < 0.05 compared with the negative control mimic.

Figure 5. Overexpression of miR-135a reduces the colony formation ability of gastric cancer cells in vitro. Anchorage-independent growth was assessed by the in vitro colony formation assay. (A, B) Representative colony formation of miR-135a mimic, negative control mimic and untransfected control MGC-803 (A) and BGC-823 (B) cells at 2 weeks. (C, D) Number of colonies containing ≥ 50 cells in miR-135a mimic, negative control mimic and untransfected control MGC-803 (C) and BGC-823 (D) cells at 2 weeks. Data are mean ± SE of three independent experiments; *p < 0.05 compared with the negative control cells.
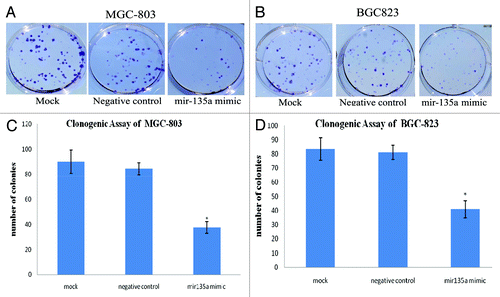
Figure 5. Overexpression of miR-135a reduces the colony formation ability of gastric cancer cells in vitro. Anchorage-independent growth was assessed by the in vitro colony formation assay. (A, B) Representative colony formation of miR-135a mimic, negative control mimic and untransfected control MGC-803 (A) and BGC-823 (B) cells at 2 weeks. (C, D) Number of colonies containing ≥ 50 cells in miR-135a mimic, negative control mimic and untransfected control MGC-803 (C) and BGC-823 (D) cells at 2 weeks. Data are mean ± SE of three independent experiments; *p < 0.05 compared with the negative control cells.

Reprints and Corporate Permissions

Please note: Selecting permissions does not provide access to the full text of the article, please see our help page How do I view content?

To request a reprint or corporate permissions for this article, please click on the relevant link below:

Academic Permissions

Please note: Selecting permissions does not provide access to the full text of the article, please see our help page How do I view content?

Obtain permissions instantly via Rightslink by clicking on the button below:

If you are unable to obtain permissions via Rightslink, please complete and submit this Permissions form. For more information, please visit our Permissions help page.