Figures & data
Table 1. Comparison of EGFR expression, EGFR and KRAS mutation, and EGFR FISH and gefitinib- and cetuximab-induced growth inhibition in various lung cancer cell lines
Figure 1. Effect of cetuximab on the cell cycle and apoptosis of sensitive cell line. (A) 11–18 cells were treated with indicated concentrations of cetuximab for 72 h, fixed, and stained with propidium iodide. The percentage of cells were analyzed in each phase of cell cycle by FACSCalibur. Experiments were done in triplicate. Bars indicate SD (B) 11–18 cells were treated with indicated concentrations of cetuximab for 72 h, and stained with PE Annexin V and 7-AAD. The percentage of apoptotic cells were analyzed using FACSCalibur. Data are the summary of percentages of early and late apoptotic cells (Annexin V positive), and expressed as mean ± SD of three independent experiments. *p < 0.05 vs. control by Mann-Whitney U test.
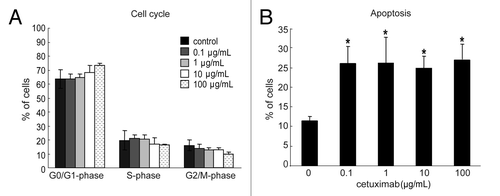
Figure 2. Phosphorylation of EGFR, ERK, AKT and STAT3, and expression and mutation status of PTEN in EGFR mutant and wild-type NSCLC cell lines. (A–D) Cells were incubated with/without serum for 24 h, and immunoblotting was done with antibodies targeting phosphorylated (p) or total EGFR, ERK, and AKT. Densitometric analysis was performed with TotaLab software (Nonlinear Dynamics), and the relative pEGFR/EGFR, pERK/ERK, pAKT/AKT, pSTAT3/STAT3 ratios are indicated as bar graphs under each blot. Experiments were repeated three times and representative results are shown. (E) PTEN protein status in each cell line was determined by immunoblotting in the presence or absence of serum. The β-actin was used as loading control. Experiments were repeated three times and representative results are shown. The mutation status of PTEN in each cell line is also indicated. WT, wild type.
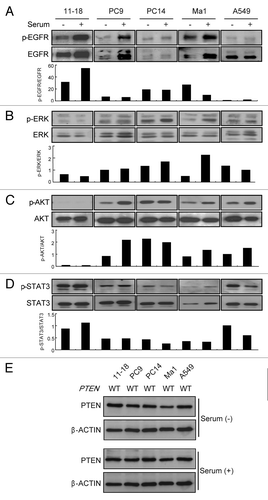
Figure 3. Influence of gefitinib and cetuximab on phosphorylation status of EGFR, ERK, AKT, in cetuximab-sensitive and -resistant NSCLC cell lines. Cetuximab-sensitive (11–18) and -resistant (PC9) cells with EGFR mutation were incubated with gefitinib (A) or cetuximab (B) at the indicated concentrations in serum-free medium for 2 h, after which cells were stimulated with EGF (100 ng/mL) for 10 min. Then the cells were lyzed, and subjected to immunoblot analysis with antibodies to phosphorylated (p) or total EGFR, ERK, and AKT, as well as an antibody targeting β-actin (loading control). Experiments were repeated three times and representative results are shown.
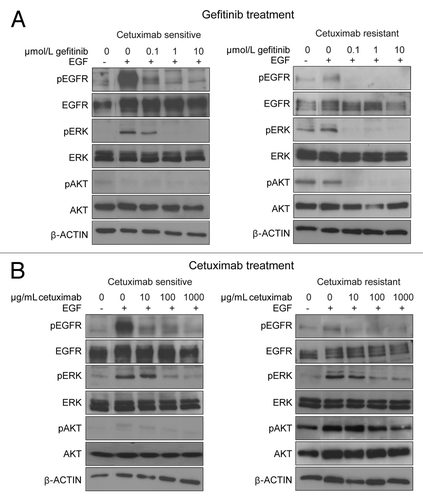
Figure 4. Effect of the modulation of AKT expression on cetuximab sensitivity of NSCLC cell lines. (A) A cetuximab-sensitive cell line (11–18) was transfected with the AKT expression vector (pCEFL-HA-AKT) or a mock control plasmid (pCEFL). After 24 h, the cells were lyzed and subjected to immunoblot analysis with the indicated antibodies. (B) Cells were treated with various concentrations of cetuximab for 72 h and then cell growth was determined by the WST-8 assay. Then, IC50 values of cetuximab were calculated for each cell. Experiments in triplicate were done three times separately and IC50 values from each experiment are combined. Bars indicate SD *p < 0.05 vs. control by Mann-Whitney U test. (C) A cetuximab-resistant cell line (Ma1) was transfected with indicated concentrations of the AKT siRNA or negative control siRNA. Cell lysates were subjected to immunoblotting with the indicated antibodies 48 h after transfection (left panel). For cell growth inhibition assay, 24 h after transfection with 50 μM of AKT siRNA or negative control siRNA, the cells were started incubating with various concentration of cetuximab for 72 h, and then cell viability was determined by the WST-8 assay and plotted as a percentage of that for untreated control cells. Bars are the SD of triplicate cultures. Data are representative of three independent experiments (right panel).
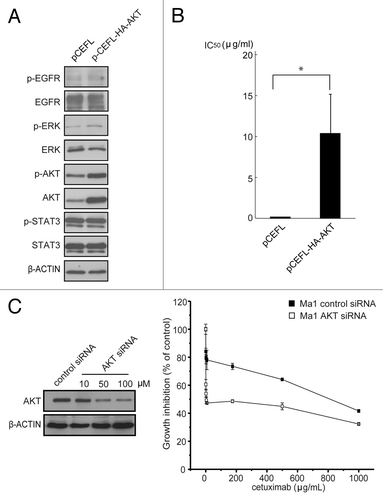
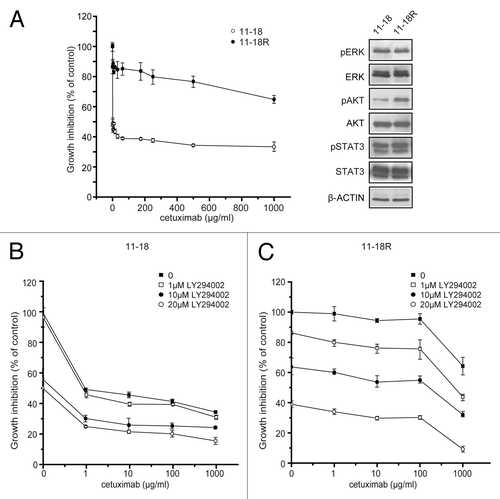
Figure 5. Effect of the combination of cetuximab and PI3K/AKT inhibitor to cetuximab resistance. Cetuximab-sensitive cells (11–18) were exposed to increasing concentrations (0.1–1,000 μg/mL) of cetuximab for six months and resistant cells (11–18R) were established. (A) Parental cells and established resistant cells were treated with the indicated concentrations of cetuximab for 72 h. Then cell viability was measured by WST-8 assay and plotted as a percentage of that for untreated control cells (left panel). Cells were grown for 24 h in the presence of serum, lysed, and subjected to immunoblotting with the indicated antibodies (right panel). (B) Parental cetuximab-sensitive cells (11–18) were treated with various concentrations of cetuximab in combination with 0, 1, 10 or 20 μM of LY294002 for 72 h. Cell viability was measured by the WST-8 assay and plotted as a percentage of that for untreated control cells. (C) The same experiment was repeated using the established cetuximab-resistant cells (11–18R). Bars are the SD of triplicate cultures. Data are representative of four independent experiments.