1,729
Views
47
CrossRef citations to date
0
Altmetric
Research Paper

Boswellic acid induces epigenetic alterations by modulating DNA methylation in colorectal cancer cells

, , , , , , , & show all
Pages 542-552 | Received 28 Nov 2011, Accepted 03 Feb 2012, Published online: 01 May 2012

Figures & data

Figure 1. AKBA exerts anticancer effects in CRC cell lines. (A) The molecular structure of AKBA. (B) AKBA treatment inhibits cell viability in RKO, SW48 and SW480 cells using a MTT assay. (C) AKBA reduces proliferation of CRC cells in a BrdU assay. AKBA induces apoptosis in RKO (D), SW48 (E) and SW480 (F) cells in an immunofluorescence staining assay that uses an anti-active caspase-3 antibody. Data are represented as mean ± standard error of mean (SEM) from three independent experiments.
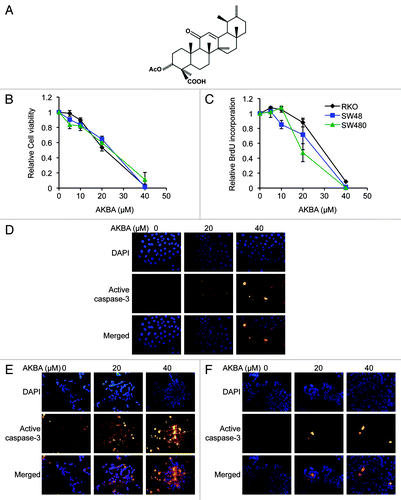
Figure 1. AKBA exerts anticancer effects in CRC cell lines. (A) The molecular structure of AKBA. (B) AKBA treatment inhibits cell viability in RKO, SW48 and SW480 cells using a MTT assay. (C) AKBA reduces proliferation of CRC cells in a BrdU assay. AKBA induces apoptosis in RKO (D), SW48 (E) and SW480 (F) cells in an immunofluorescence staining assay that uses an anti-active caspase-3 antibody. Data are represented as mean ± standard error of mean (SEM) from three independent experiments.

Figure 2. AKBA demethylates CpG islands in CRC cells. (A) A scatter plot comparing the β-values of all CpG loci between control and DAC-treated (2.5 μM) SW48 CRC cells (top panel), and between control and AKBA (20 μM) treated cells (bottom panel). Colored dots represent β-value densities for each CpG locus. The histograms represent mean β-value distribution in SW48 cells treated with DAC (top panel) and those treated with AKBA for 6 d (bottom panel). The horizontal line within the box represents the median values. The upper and lower lines in the box plot represent 75th and 25th percentiles. The horizontal bars above and below the boxes represent the maximum and the minimum values. The small black box within each box plot represents median β-values. The differences in the mean β-values between the control, DAC and AKBA treated SW48 cells were analyzed by use of a two-tailed Student’s t-test. (B) A heat map illustration of the DNA methylation pattern of the control and AKBA treated cells (left panel). The gradient of blue to yellow represents individual β-values, and the degree of methylation from low (blue) to high (yellow; 0 to 1) as indicated. The three clusters of genes that demonstrated the most significant DNA demethylation after AKBA treatment are shown with red boxes. A close-up view of the heat maps corresponding to the subset of demethylated genes in the clusters 1, 2 and 3 are represented in the right panel. (C) The scatter plot of the β-values from the gene clusters 1, 2 and 3 (red, green and blue respectively) in AKBA vs control cells.
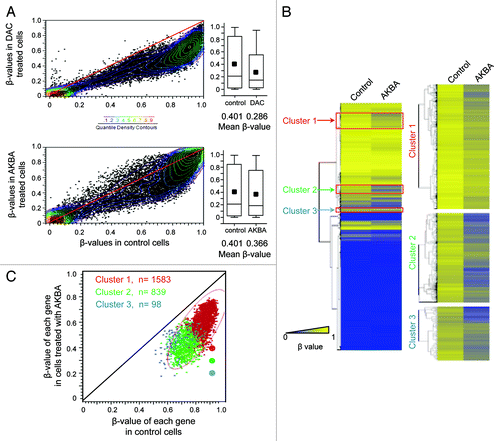
Figure 2. AKBA demethylates CpG islands in CRC cells. (A) A scatter plot comparing the β-values of all CpG loci between control and DAC-treated (2.5 μM) SW48 CRC cells (top panel), and between control and AKBA (20 μM) treated cells (bottom panel). Colored dots represent β-value densities for each CpG locus. The histograms represent mean β-value distribution in SW48 cells treated with DAC (top panel) and those treated with AKBA for 6 d (bottom panel). The horizontal line within the box represents the median values. The upper and lower lines in the box plot represent 75th and 25th percentiles. The horizontal bars above and below the boxes represent the maximum and the minimum values. The small black box within each box plot represents median β-values. The differences in the mean β-values between the control, DAC and AKBA treated SW48 cells were analyzed by use of a two-tailed Student’s t-test. (B) A heat map illustration of the DNA methylation pattern of the control and AKBA treated cells (left panel). The gradient of blue to yellow represents individual β-values, and the degree of methylation from low (blue) to high (yellow; 0 to 1) as indicated. The three clusters of genes that demonstrated the most significant DNA demethylation after AKBA treatment are shown with red boxes. A close-up view of the heat maps corresponding to the subset of demethylated genes in the clusters 1, 2 and 3 are represented in the right panel. (C) The scatter plot of the β-values from the gene clusters 1, 2 and 3 (red, green and blue respectively) in AKBA vs control cells.

Figure 3. Correlation between DNA demethylation and re-expression of the corresponding genes in AKBA treated CRC cells. The scatter plot illustration of DNA methylation (β-values) data obtained from genome-wide methylation arrays and the changes in gene expression analyzed by microarray analyses in SW48 cells treated with AKBA. The methylation status after AKBA treatment is shown for each gene from clusters 1, 2 or 3 (colored red, green or blue, respectively, left panel). As shown in the right panel, the majority of demethylated genes within each of the three clusters were upregulated after AKBA treatment (76, 78, and 73% respectively).
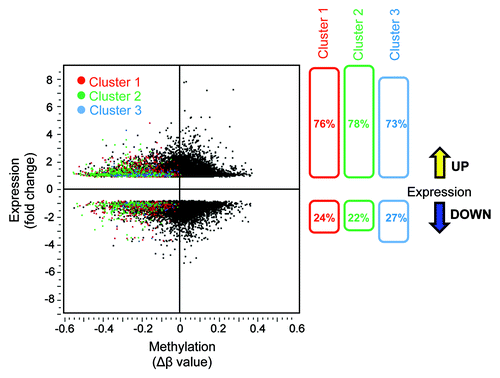
Figure 3. Correlation between DNA demethylation and re-expression of the corresponding genes in AKBA treated CRC cells. The scatter plot illustration of DNA methylation (β-values) data obtained from genome-wide methylation arrays and the changes in gene expression analyzed by microarray analyses in SW48 cells treated with AKBA. The methylation status after AKBA treatment is shown for each gene from clusters 1, 2 or 3 (colored red, green or blue, respectively, left panel). As shown in the right panel, the majority of demethylated genes within each of the three clusters were upregulated after AKBA treatment (76, 78, and 73% respectively).

Figure 4. The pathway analysis revealed the most affected molecular pathway by AKBA. (A) The pathway analysis revealed that CRC metastasis signaling was among one of the top five canonical pathways that served as a target of AKBA-induced demethylation in CRC cells. (B) An illustration from Ingenuity Pathway Analysis (IPA) demonstrating the biological relationship between demethylated and overexpressed genes from the 3 genes clusters. Green bolded BM represents the genes that are described as biomarkers of CRC, Orange Fx represents the genes that have direct function in CRC, and CP represents the canonical pathway involved in CRC metastasis signaling. One of the genes, SMPD3, which was found within the most demethylated gene group “cluster 1” in the methylation microarray analysis and subsequently confirmed in our validation analysis (expression by qRT-PCR and methylation by qMSP), is marked with “*” in red. Density of red color of icons and the number below the icons represents the fold change of gene expression induced by AKBA obtained in our genome-wide gene expression analysis.
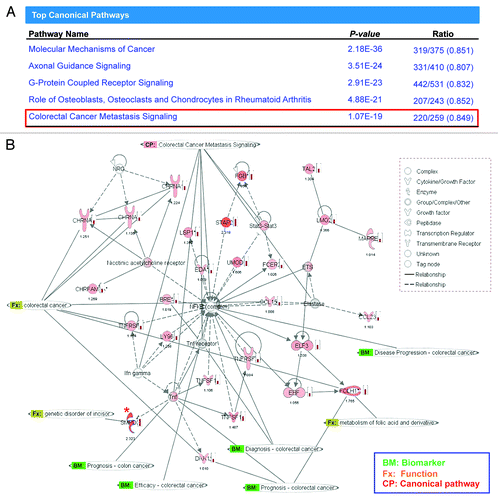
Figure 4. The pathway analysis revealed the most affected molecular pathway by AKBA. (A) The pathway analysis revealed that CRC metastasis signaling was among one of the top five canonical pathways that served as a target of AKBA-induced demethylation in CRC cells. (B) An illustration from Ingenuity Pathway Analysis (IPA) demonstrating the biological relationship between demethylated and overexpressed genes from the 3 genes clusters. Green bolded BM represents the genes that are described as biomarkers of CRC, Orange Fx represents the genes that have direct function in CRC, and CP represents the canonical pathway involved in CRC metastasis signaling. One of the genes, SMPD3, which was found within the most demethylated gene group “cluster 1” in the methylation microarray analysis and subsequently confirmed in our validation analysis (expression by qRT-PCR and methylation by qMSP), is marked with “*” in red. Density of red color of icons and the number below the icons represents the fold change of gene expression induced by AKBA obtained in our genome-wide gene expression analysis.

Figure 5. Validation of DNA methylation and gene expression status of the selected putative tumor suppressor genes in three CRC cell lines. Re-expression and demethylation of nine putative tumor suppressor genes were confirmed by real-time RT-PCR and quantitative MSP in three CRC cell lines: SW48 (A), SW480 (B) and RKO (C) treated with 20 μM AKBA (SW48 and RKO) or 30 μM of AKBA (SW480) for 6 d. Six of the nine genes (CCNG2, FHIT, PTPRG, PRDM13, SAMD14 and TP53BP2) were upregulated along with demethylation in at least in two of the cell lines. Data are represented as mean ± SEM from two or three independent experiments.
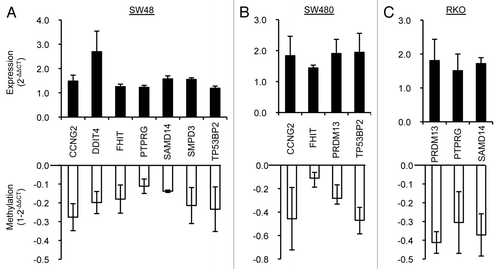
Figure 5. Validation of DNA methylation and gene expression status of the selected putative tumor suppressor genes in three CRC cell lines. Re-expression and demethylation of nine putative tumor suppressor genes were confirmed by real-time RT-PCR and quantitative MSP in three CRC cell lines: SW48 (A), SW480 (B) and RKO (C) treated with 20 μM AKBA (SW48 and RKO) or 30 μM of AKBA (SW480) for 6 d. Six of the nine genes (CCNG2, FHIT, PTPRG, PRDM13, SAMD14 and TP53BP2) were upregulated along with demethylation in at least in two of the cell lines. Data are represented as mean ± SEM from two or three independent experiments.

Figure 6. AKBA inhibits DNMT activity in CRC cells. DNMT activity was measured in SW48 (A) and SW480 (B) cells treated with DMSO, 20 μM AKBA and 40 μM AKBA for three days. Data are represented as mean ± SEM from three independent experiments.
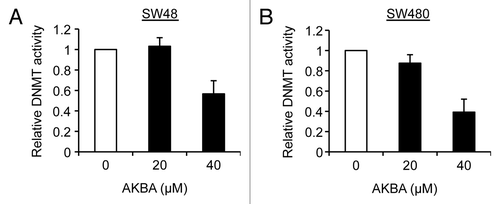
Figure 6. AKBA inhibits DNMT activity in CRC cells. DNMT activity was measured in SW48 (A) and SW480 (B) cells treated with DMSO, 20 μM AKBA and 40 μM AKBA for three days. Data are represented as mean ± SEM from three independent experiments.

Table 1. Primers used in this study

Reprints and Corporate Permissions

Please note: Selecting permissions does not provide access to the full text of the article, please see our help page How do I view content?

To request a reprint or corporate permissions for this article, please click on the relevant link below:

Academic Permissions

Please note: Selecting permissions does not provide access to the full text of the article, please see our help page How do I view content?

Obtain permissions instantly via Rightslink by clicking on the button below:

If you are unable to obtain permissions via Rightslink, please complete and submit this Permissions form. For more information, please visit our Permissions help page.