1,107
Views
44
CrossRef citations to date
0
Altmetric
Research Paper

Suppression of CX43 expression by miR-20a in the progression of human prostate cancer

, , , , , & show all
Pages 890-898 | Received 20 Jan 2012, Accepted 22 May 2012, Published online: 01 Aug 2012

Figures & data

Figure 1. MiR-20a is highly expressed and inversely correlated with CX43 in prostate cancer tissues and cell lines. (A-C) The expression level of miR-20a (A), CX43 mRNA (B) and CX43 protein level (C) were measured in nine pairs of prostate tissues, MDA-PCa-2b and LNCaP cell lines by real-time qRT-PCR and western blot with U6 snRNA, β-actin or GAPDH as the control. The expression of miR-20a and CX43 mRNA were determined by triplicate measurements for each sample and were quantified using the 2-ΔΔCt method. Representative western photos were shown. The expression level in normal tissues is set to 1. Student′s t test were performed to analyze the significance of differences between sample means. *, p < 0.05. (D-E) The correlation of CX43 mRNA and miR-20a levels (D, r = -0.656) and CX43 protein and miR-20a levels (E, r = -0.889) are shown. *, p < 0.05, **, p < 0.01.
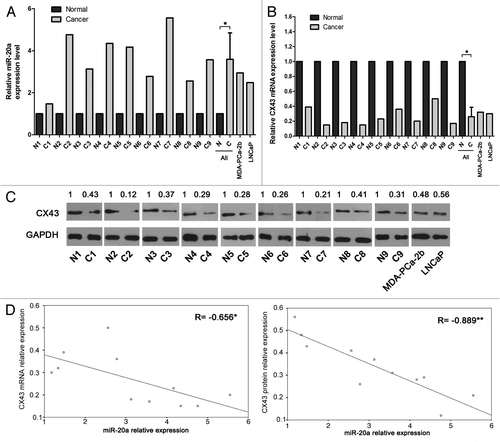
Figure 1. MiR-20a is highly expressed and inversely correlated with CX43 in prostate cancer tissues and cell lines. (A-C) The expression level of miR-20a (A), CX43 mRNA (B) and CX43 protein level (C) were measured in nine pairs of prostate tissues, MDA-PCa-2b and LNCaP cell lines by real-time qRT-PCR and western blot with U6 snRNA, β-actin or GAPDH as the control. The expression of miR-20a and CX43 mRNA were determined by triplicate measurements for each sample and were quantified using the 2-ΔΔCt method. Representative western photos were shown. The expression level in normal tissues is set to 1. Student′s t test were performed to analyze the significance of differences between sample means. *, p < 0.05. (D-E) The correlation of CX43 mRNA and miR-20a levels (D, r = -0.656) and CX43 protein and miR-20a levels (E, r = -0.889) are shown. *, p < 0.05, **, p < 0.01.

Figure 2. Downregulation of miR-20a significantly inhibits the proliferation of the MDA-PCa-2b cell line. (A) The expression level of miR-20a following transfection of miR-20a inhibitor in MDA-PCa-2b and LNCaP cells. The control vector and mock transfection were used as controls. 48 h after transfection, cell were harvested and the expression of miR-20a was examined by real-time qRT-PCR. Transfection of miR-20a inhibitor decreased the expression of miR-20a in MDA-PCa-2b and LNCaP cell lines significantly. (B) MDA-PCa-2b and LNCaP cells were transfected with miR-20a inhibitor, and control vector and mock transfection were used as controls. Twenty-four hours after transfection, cells were seeded into 96-well plate for CCK-8 assays (B) or into 12-well plate for cell colony assays (C). The colony formation and CCK-8 assay showed that the knockdown of miR-20a in MDA-PCa-2b cells inhibited cell proliferation more significantly than that in LNCaP cells. *, p < 0.05.
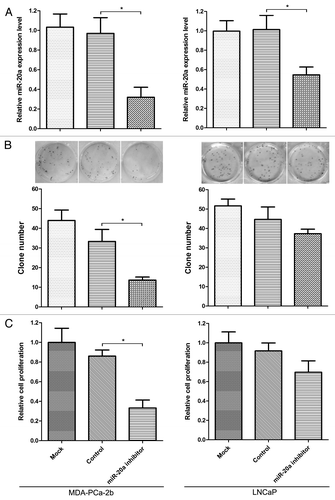
Figure 2. Downregulation of miR-20a significantly inhibits the proliferation of the MDA-PCa-2b cell line. (A) The expression level of miR-20a following transfection of miR-20a inhibitor in MDA-PCa-2b and LNCaP cells. The control vector and mock transfection were used as controls. 48 h after transfection, cell were harvested and the expression of miR-20a was examined by real-time qRT-PCR. Transfection of miR-20a inhibitor decreased the expression of miR-20a in MDA-PCa-2b and LNCaP cell lines significantly. (B) MDA-PCa-2b and LNCaP cells were transfected with miR-20a inhibitor, and control vector and mock transfection were used as controls. Twenty-four hours after transfection, cells were seeded into 96-well plate for CCK-8 assays (B) or into 12-well plate for cell colony assays (C). The colony formation and CCK-8 assay showed that the knockdown of miR-20a in MDA-PCa-2b cells inhibited cell proliferation more significantly than that in LNCaP cells. *, p < 0.05.

Figure 3. MiR-20a inhibits the expression of CX43 by binding to 3′-UTR. (A) Sequence alignment of miR-20a with the wild-type and mutant 3′UTR of CX43. (B-C) The expression of CX43 in MDA-PCa-2b cells transfected by miR-20a inhibitor was tested by real-time qRT-PCR detection (B) and western blot (C) and the relative expression was shown. Normalization was performed with β-actin and GAPDH. The expression of CX43 in mock transfection group was set as 1. (D) CX43 UTR or CX43 UTR-M was transfected alone or cotransfected with miR-20a inhibitor or control vectors into MDA-PCa-2b cells. Forty-eight hours later, cells were lyzed and analyzed. The intensity of firefly luciferase in cells cotransfected with CX43 UTR and miR-20a inhibitor was increased after 48 h (p < 0.05). However, miR-20a inhibitor had no effect on the intensity of firefly luciferase when cells were transfected with the 3′UTR mutant vector (p > 0.05). Relative fluorescence intensity of the value with transfection of CX43 UTR alone was set as 1. Values represent means ± SEM from three independent experiments. One-way ANOVA test were performed to analyze the significance of differences. *, p < 0.05.
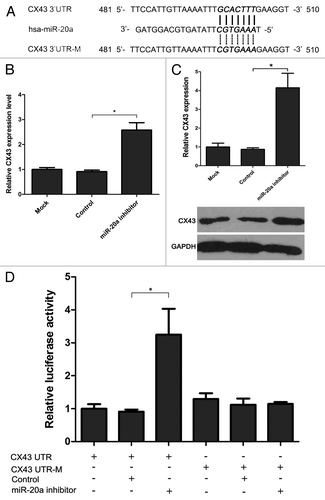
Figure 3. MiR-20a inhibits the expression of CX43 by binding to 3′-UTR. (A) Sequence alignment of miR-20a with the wild-type and mutant 3′UTR of CX43. (B-C) The expression of CX43 in MDA-PCa-2b cells transfected by miR-20a inhibitor was tested by real-time qRT-PCR detection (B) and western blot (C) and the relative expression was shown. Normalization was performed with β-actin and GAPDH. The expression of CX43 in mock transfection group was set as 1. (D) CX43 UTR or CX43 UTR-M was transfected alone or cotransfected with miR-20a inhibitor or control vectors into MDA-PCa-2b cells. Forty-eight hours later, cells were lyzed and analyzed. The intensity of firefly luciferase in cells cotransfected with CX43 UTR and miR-20a inhibitor was increased after 48 h (p < 0.05). However, miR-20a inhibitor had no effect on the intensity of firefly luciferase when cells were transfected with the 3′UTR mutant vector (p > 0.05). Relative fluorescence intensity of the value with transfection of CX43 UTR alone was set as 1. Values represent means ± SEM from three independent experiments. One-way ANOVA test were performed to analyze the significance of differences. *, p < 0.05.

Figure 4. Overexpression of CX43 reverses miR-20a function in MDA-PCa-2b cells. (A-B) Transfection of CX43 expression plasmid increased the mRNA (A) and protein (B) expression of CX43 in MDA-PCa-2b cells. CX43 expression plasmid with mutant 3′UTR (Mut CX43) can significantly increase the mRNA and protein level of CX43 than Wt CX43. (C-D) The effects of Wt CX43 and Mut CX43 on cell viability and proliferation were evaluated by CKK-8 and cell colony formation assays. Overexpression of CX43 with mutated miR-20a target site in MDA-PCa-2b cells more significantly decreased the proliferation compared with CX43 with wild-type miR-20a target site. One-way ANOVA test were performed to analyze the significance of differences from three independent experiments. *, p < 0.05.
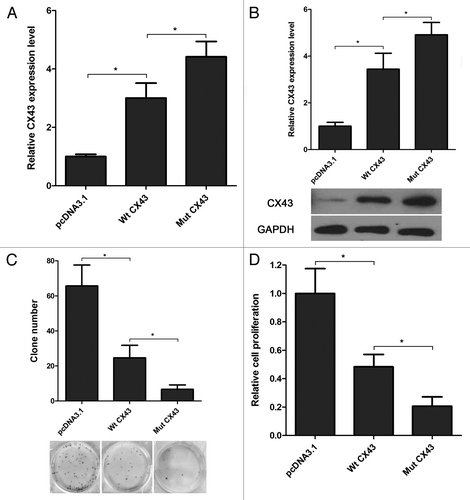
Figure 4. Overexpression of CX43 reverses miR-20a function in MDA-PCa-2b cells. (A-B) Transfection of CX43 expression plasmid increased the mRNA (A) and protein (B) expression of CX43 in MDA-PCa-2b cells. CX43 expression plasmid with mutant 3′UTR (Mut CX43) can significantly increase the mRNA and protein level of CX43 than Wt CX43. (C-D) The effects of Wt CX43 and Mut CX43 on cell viability and proliferation were evaluated by CKK-8 and cell colony formation assays. Overexpression of CX43 with mutated miR-20a target site in MDA-PCa-2b cells more significantly decreased the proliferation compared with CX43 with wild-type miR-20a target site. One-way ANOVA test were performed to analyze the significance of differences from three independent experiments. *, p < 0.05.

Figure 5. In vivo anti-prostate cancer effect of miR-20a. (A) MDA-PCa-2b cells transfected with miR-20a inhibitor or control vector were injected subcutaneously in the nude mice. n = 8 mice per group. Mice were sacrificed 25 d later for evaluation. Gross morphology of tumor was shown. (B) miR-20a inhibitor significantly decreased the volume of tumors compared with the control group. (C-D) Analysis of miR-20a expression level (C) and CX43 mRNA (D) and protein (E) expression level in solid tumors by real-time qRT-PCR and western blot. U6 snRNA, β-actin or GAPDH as the control. One-way ANOVA test were used and mock transfecion group were set as 1. *, p < 0.05.
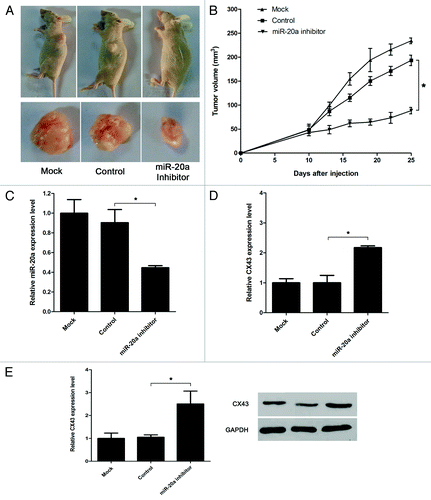
Figure 5. In vivo anti-prostate cancer effect of miR-20a. (A) MDA-PCa-2b cells transfected with miR-20a inhibitor or control vector were injected subcutaneously in the nude mice. n = 8 mice per group. Mice were sacrificed 25 d later for evaluation. Gross morphology of tumor was shown. (B) miR-20a inhibitor significantly decreased the volume of tumors compared with the control group. (C-D) Analysis of miR-20a expression level (C) and CX43 mRNA (D) and protein (E) expression level in solid tumors by real-time qRT-PCR and western blot. U6 snRNA, β-actin or GAPDH as the control. One-way ANOVA test were used and mock transfecion group were set as 1. *, p < 0.05.
Supplemental material

Additional material

Download Zip (91 KB)

Reprints and Corporate Permissions

Please note: Selecting permissions does not provide access to the full text of the article, please see our help page How do I view content?

To request a reprint or corporate permissions for this article, please click on the relevant link below:

Academic Permissions

Please note: Selecting permissions does not provide access to the full text of the article, please see our help page How do I view content?

Obtain permissions instantly via Rightslink by clicking on the button below:

If you are unable to obtain permissions via Rightslink, please complete and submit this Permissions form. For more information, please visit our Permissions help page.