911
Views
18
CrossRef citations to date
0
Altmetric
Research Paper

Inauhzin and Nutlin3 synergistically activate p53 and suppress tumor growth

, , , , &
Pages 915-924 | Received 14 Mar 2012, Accepted 22 May 2012, Published online: 01 Aug 2012

Figures & data

Figure 1. Inauhzin and Nutlin-3 significantly enhance the expression level and activity of p53 in HCT116 p53+/+ cells in a dose-dependent manner. HCT116 p53+/+ cells were treated with Inauhzin or Nutlin-3 at the indicated concentrations for 18 h and harvested for WB analysis. 50 μg protein was loaded in each lane, and an anti-α-tublin antibody was used as an loading control. Densitometric analysis of immunoreactive bands of p53, p21 and cleaved-PARP was expressed as fold change relative to the control group.
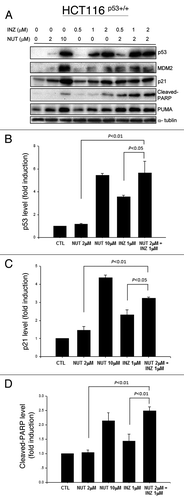
Figure 1. Inauhzin and Nutlin-3 significantly enhance the expression level and activity of p53 in HCT116 p53+/+ cells in a dose-dependent manner. HCT116 p53+/+ cells were treated with Inauhzin or Nutlin-3 at the indicated concentrations for 18 h and harvested for WB analysis. 50 μg protein was loaded in each lane, and an anti-α-tublin antibody was used as an loading control. Densitometric analysis of immunoreactive bands of p53, p21 and cleaved-PARP was expressed as fold change relative to the control group.
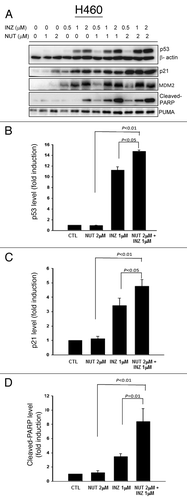
Figure 2. Inauhzin and Nutlin-3 significantly enhance the expression level and activity of p53 in H460 cells in a dose-dependent manner. H460 Cells were treated with Inauhzin or Nutlin-3 at the indicated concentrations for 18 h and harvested for WB analysis. 50 μg protein was loaded in each lane, and an anti-β-actin antibody was used as an loading control. Densitometric analysis of immunoreactive bands of p53, p21 and cleaved-PARP was expressed as fold change relative to the control group.

Figure 2. Inauhzin and Nutlin-3 significantly enhance the expression level and activity of p53 in H460 cells in a dose-dependent manner. H460 Cells were treated with Inauhzin or Nutlin-3 at the indicated concentrations for 18 h and harvested for WB analysis. 50 μg protein was loaded in each lane, and an anti-β-actin antibody was used as an loading control. Densitometric analysis of immunoreactive bands of p53, p21 and cleaved-PARP was expressed as fold change relative to the control group.

Figure 3. Inauhzin and Nutlin-3 demonstrate synergistic cytotoxicity in the Nutlin-3 low-sensitive cells. H460 (A) and HCT116 p53+/+ (B) cells were plated in 96-well plates and treated with Inauhzin or Nutlin-3 individually at serial dilutions, or both simultaneously at fixed molar drug ratios (INZ: NUT = 1:4 or 1:10) for 72 h. Cell viability was determined using a WST cell growth assay. The data here represent the mean of three independent experiments ± SEM. CI values presented indicate the interaction of Inauhzin with Nutlin-3 when the combined treatment inhibits cell growth by 25% (ED25), 50% (ED50) or 75% (ED75), compared with the control for their individual treatment alone.
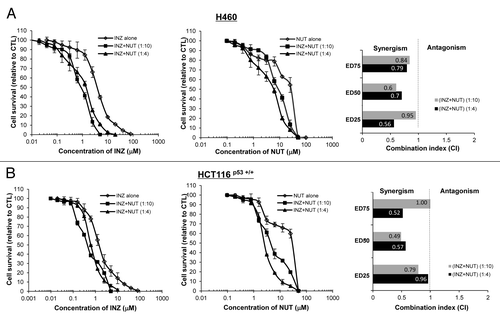
Figure 3. Inauhzin and Nutlin-3 demonstrate synergistic cytotoxicity in the Nutlin-3 low-sensitive cells. H460 (A) and HCT116 p53+/+ (B) cells were plated in 96-well plates and treated with Inauhzin or Nutlin-3 individually at serial dilutions, or both simultaneously at fixed molar drug ratios (INZ: NUT = 1:4 or 1:10) for 72 h. Cell viability was determined using a WST cell growth assay. The data here represent the mean of three independent experiments ± SEM. CI values presented indicate the interaction of Inauhzin with Nutlin-3 when the combined treatment inhibits cell growth by 25% (ED25), 50% (ED50) or 75% (ED75), compared with the control for their individual treatment alone.

Figure 5. INZ significantly enhances the pro-apoptotic effect of Nutlin-3 on H460 and HCT116 p53+/+ cells. H460 (A) and HCT116 p53+/+ (B) were plated in 6cm-diameter dishes, and treated with Inauhzin and Nutlin-3 at the indicated concentrations for 48 h. Cells were stained with propidium iodide, and subjected to flow cytometry to determine the DNA content. The apoptotic cells, identified by sub-G1 DNA content, were presented as the M1 population. The data was expressed as the mean ± SEM (n = 4). *p < 0.01 vs. INZ 1μM. #p < 0.01 vs. NUT 4μM. &p < 0.01 vs. NUT 10μM.
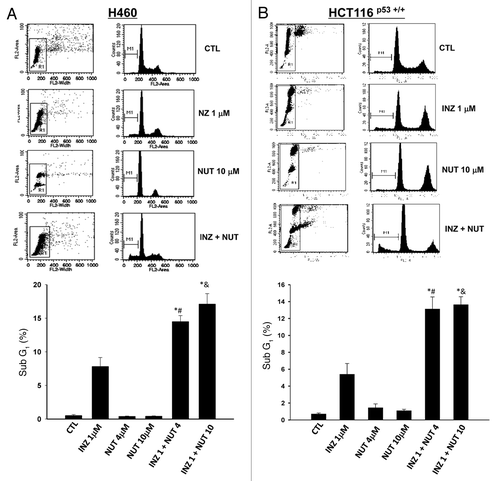
Figure 5. INZ significantly enhances the pro-apoptotic effect of Nutlin-3 on H460 and HCT116 p53+/+ cells. H460 (A) and HCT116 p53+/+ (B) were plated in 6cm-diameter dishes, and treated with Inauhzin and Nutlin-3 at the indicated concentrations for 48 h. Cells were stained with propidium iodide, and subjected to flow cytometry to determine the DNA content. The apoptotic cells, identified by sub-G1 DNA content, were presented as the M1 population. The data was expressed as the mean ± SEM (n = 4). *p < 0.01 vs. INZ 1μM. #p < 0.01 vs. NUT 4μM. &p < 0.01 vs. NUT 10μM.

Figure 4. Inauhzin significantly enhances the inhibition of cell proliferation induced by low dose of Nutlin-3 in H460 and HCT116 p53+/+ cells. H460 (A) and HCT116 p53+/+ (B) were plated in 6cm-diameter dishes, and treated with Inauhzin and Nutlin-3 at the indicated concentrations for 48 h. Immunofluorescence was performed to determine the amount of BrdU incorporation. Representative images of BrdU immunostaining were shown (Magnification 200 × ), and quantitative analysis was performed. The data was presented as the mean of the ratios of BrdU positive cells and total cells ± SEM (n = 3). *p < 0.01 vs. INZ 1μM. #p = 0.05 vs. NUT 4μM (A) or p = 0.1 vs. NUT 4μM (B).
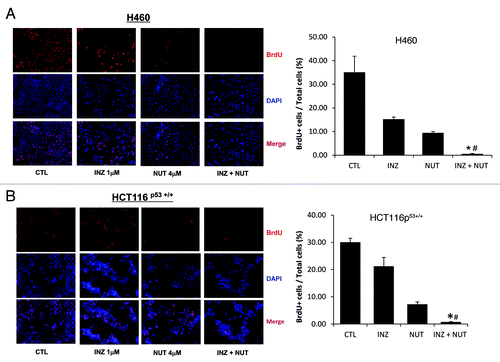
Figure 4. Inauhzin significantly enhances the inhibition of cell proliferation induced by low dose of Nutlin-3 in H460 and HCT116 p53+/+ cells. H460 (A) and HCT116 p53+/+ (B) were plated in 6cm-diameter dishes, and treated with Inauhzin and Nutlin-3 at the indicated concentrations for 48 h. Immunofluorescence was performed to determine the amount of BrdU incorporation. Representative images of BrdU immunostaining were shown (Magnification 200 × ), and quantitative analysis was performed. The data was presented as the mean of the ratios of BrdU positive cells and total cells ± SEM (n = 3). *p < 0.01 vs. INZ 1μM. #p = 0.05 vs. NUT 4μM (A) or p = 0.1 vs. NUT 4μM (B).

Figure 6. Combination of low doses of Inauhzin and Nutlin-3 demonstrates a significant synergy on p53 induction, apoptosis and tumor suppression of HCT116 p53+/+ xenografts. (A) Combination of Inauhzin and Nutlin-3 presented a remarkable suppression on the growth of xenograft tumors derived from HCT116 p53+/+ cells. Mice bearing HCT116 p53+/+ xenografts were treated with INZ (15 mg/Kg) intraperitoneally every day, NUT orally (150 mg/Kg twice per day, 4 continuous days followed by 2 d off), or vehicles for 21 d. Images of tumors isolated are presented at the left. The tumor growth is shown by the mean tumor volumes ± SEM (middle), and the final tumor weight is shown in columns (right) (n = 6 mice per group; *p < 0.05). (B) WB analysis of proteins extracted from HCT116p53+/+ tumor samples in panel A with antibodies as indicated on right. (C) Representative images of TUNEL staining, BrdU and p53 immunostaining of xenograft tumor sections are presented. Quantification of BrdU and TUNEL staining is expressed as Mean ± SEM (n = 4 mice per group).
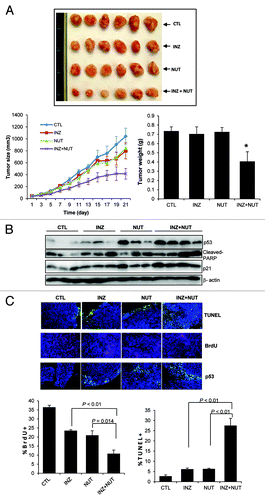
Figure 6. Combination of low doses of Inauhzin and Nutlin-3 demonstrates a significant synergy on p53 induction, apoptosis and tumor suppression of HCT116 p53+/+ xenografts. (A) Combination of Inauhzin and Nutlin-3 presented a remarkable suppression on the growth of xenograft tumors derived from HCT116 p53+/+ cells. Mice bearing HCT116 p53+/+ xenografts were treated with INZ (15 mg/Kg) intraperitoneally every day, NUT orally (150 mg/Kg twice per day, 4 continuous days followed by 2 d off), or vehicles for 21 d. Images of tumors isolated are presented at the left. The tumor growth is shown by the mean tumor volumes ± SEM (middle), and the final tumor weight is shown in columns (right) (n = 6 mice per group; *p < 0.05). (B) WB analysis of proteins extracted from HCT116p53+/+ tumor samples in panel A with antibodies as indicated on right. (C) Representative images of TUNEL staining, BrdU and p53 immunostaining of xenograft tumor sections are presented. Quantification of BrdU and TUNEL staining is expressed as Mean ± SEM (n = 4 mice per group).

Figure 7. The model for the mechanisms underlying the p53-dependent synergistic anti-tumor effect of Inauhzin and Nutlin-3. As a blocker of the binding of MDM2 to p53, Nutlin-3 inhibits MDM2-dependent ubiquitination and degradation of p53, releasing more p53 molecules for acetylation at its C-terminus. In comparison with Nutlin-3, Inauhzin induces p53 acetylation by inhibiting SIRT1-mediated deacetylation at K382. Thereby this posttranslational modification further prevents the association of MDM2 with p53, blocks the ubiquitination sites from MDM2 and attenuates the MDM2-mediated ubiquitination of these lysine residues within p53, consequently activating p53. The sum outcome of the co-treatment of p53-contaning cancerous cells with two compounds is, therefore, the more remarkable induction of p53 acetylation, level and activity, consequently suppressing tumor growth in a p53-dependent fashion. Arrows indicate activation or increase, while bars denote inactivation.
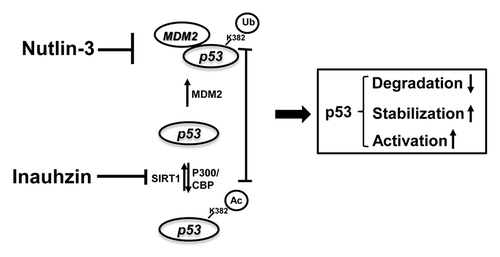
Figure 7. The model for the mechanisms underlying the p53-dependent synergistic anti-tumor effect of Inauhzin and Nutlin-3. As a blocker of the binding of MDM2 to p53, Nutlin-3 inhibits MDM2-dependent ubiquitination and degradation of p53, releasing more p53 molecules for acetylation at its C-terminus. In comparison with Nutlin-3, Inauhzin induces p53 acetylation by inhibiting SIRT1-mediated deacetylation at K382. Thereby this posttranslational modification further prevents the association of MDM2 with p53, blocks the ubiquitination sites from MDM2 and attenuates the MDM2-mediated ubiquitination of these lysine residues within p53, consequently activating p53. The sum outcome of the co-treatment of p53-contaning cancerous cells with two compounds is, therefore, the more remarkable induction of p53 acetylation, level and activity, consequently suppressing tumor growth in a p53-dependent fashion. Arrows indicate activation or increase, while bars denote inactivation.
Supplemental material

Additional material

Download Zip (1.3 MB)

Reprints and Corporate Permissions

Please note: Selecting permissions does not provide access to the full text of the article, please see our help page How do I view content?

To request a reprint or corporate permissions for this article, please click on the relevant link below:

Academic Permissions

Please note: Selecting permissions does not provide access to the full text of the article, please see our help page How do I view content?

Obtain permissions instantly via Rightslink by clicking on the button below:

If you are unable to obtain permissions via Rightslink, please complete and submit this Permissions form. For more information, please visit our Permissions help page.