1,003
Views
23
CrossRef citations to date
0
Altmetric
Research Paper

Preclinical modeling of EGFR inhibitor resistance in head and neck cancer

, , &
Pages 935-945 | Received 20 Mar 2012, Accepted 22 May 2012, Published online: 01 Aug 2012

Figures & data

Figure 1. HNSCC cells demonstrate a relatively narrow range of sensitivity to erlotinib. A panel of 8 HNSCC cell lines (HN-5, PCI-15B, 686LN, OSC-19, UM-22B, SCC1, CAL33, UM-22A) were treated in triplicate with erlotinib for 72 h followed by MTT assay. Relative IC50s were calculated from three independent experiments. IC50 values range from 1.56 μM to 6.6μM in HNSCC cell lines. HeLa cells were used as a control to demonstrate in vitro resistance to erlotinib (IC50 = 44.60 μM).
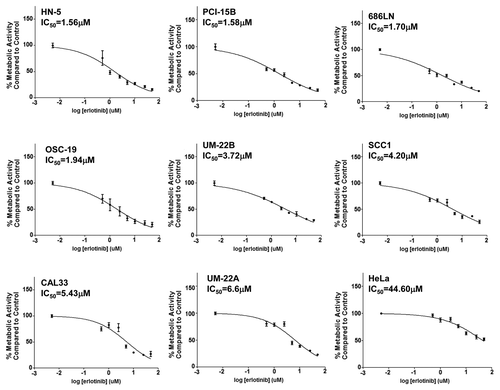
Figure 1. HNSCC cells demonstrate a relatively narrow range of sensitivity to erlotinib. A panel of 8 HNSCC cell lines (HN-5, PCI-15B, 686LN, OSC-19, UM-22B, SCC1, CAL33, UM-22A) were treated in triplicate with erlotinib for 72 h followed by MTT assay. Relative IC50s were calculated from three independent experiments. IC50 values range from 1.56 μM to 6.6μM in HNSCC cell lines. HeLa cells were used as a control to demonstrate in vitro resistance to erlotinib (IC50 = 44.60 μM).

Figure 2. 686LN cells are sensitive to erlotinib in vivo. (A) The HNSCC cell line 686LN was used to create xenografts in nude mice from one million cells per xenograft with Matrigel (n = 9). HeLa cells were used as an erlotinib-resistant control at a rate of one million cells per inoculation to create erlotinib-resistant control xenografts (n = 9). Animals were treated with 50 mg/kg erlotinib five times per week by oral gavage and a significant difference in tumor volumes was observed between the two cell lines on day 10 (p = 0.0036). (B) The 686LN cell line was used to create xenografts in nude mice from one million cells per xenograft with Matrigel (n = 9). HeLa cells were used as a cetuximab-resistant control at a rate of one million cells per inoculation to create xenografts (n = 9). Animals were treated with a higher than therapeutic dose of cetuximab, 2 mg weekly, by intraperitoneal injection and a significant difference in tumor volumes was observed between the two cell lines on day 10 (p = 0.0013).
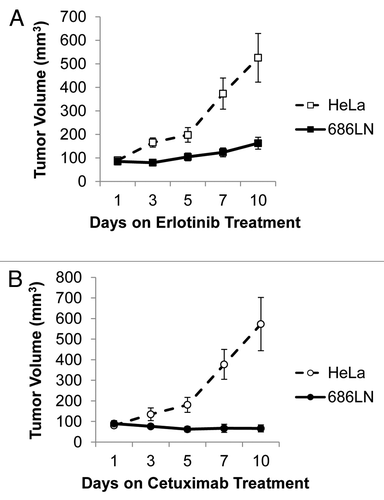
Figure 2. 686LN cells are sensitive to erlotinib in vivo. (A) The HNSCC cell line 686LN was used to create xenografts in nude mice from one million cells per xenograft with Matrigel (n = 9). HeLa cells were used as an erlotinib-resistant control at a rate of one million cells per inoculation to create erlotinib-resistant control xenografts (n = 9). Animals were treated with 50 mg/kg erlotinib five times per week by oral gavage and a significant difference in tumor volumes was observed between the two cell lines on day 10 (p = 0.0036). (B) The 686LN cell line was used to create xenografts in nude mice from one million cells per xenograft with Matrigel (n = 9). HeLa cells were used as a cetuximab-resistant control at a rate of one million cells per inoculation to create xenografts (n = 9). Animals were treated with a higher than therapeutic dose of cetuximab, 2 mg weekly, by intraperitoneal injection and a significant difference in tumor volumes was observed between the two cell lines on day 10 (p = 0.0013).

Figure 3. EGFR protein levels correlate with sensitivity to erlotinib.(A) 686LN cells have higher levels of EGFR on the cell surface compared with the EGFR-inhibitor resistant HeLa cell line. Live cell sorting was used on 686LN cells and HeLa cells with gating to exclude cells that uptake propidium iodine and to identify a population of low-EGFR expressing cells (0.20 ± 0.01% for 686LN cells and 14.85 ± 0.24% for HeLa cells). (B) Whole cell lysates were created from cells plated at 70% confluency in standard media and proteins were resolved and immunostained (α-EGFR, BD Transduction Labs). Densitometry was calculated as an average from three independent experiments. C. Spearman correlation of EGFR protein level with erlotinib IC50.
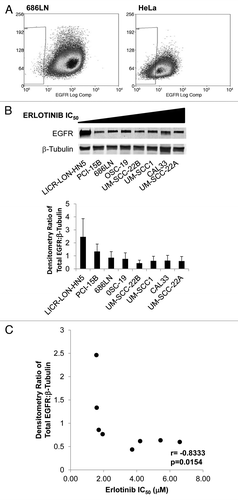
Figure 3. EGFR protein levels correlate with sensitivity to erlotinib.(A) 686LN cells have higher levels of EGFR on the cell surface compared with the EGFR-inhibitor resistant HeLa cell line. Live cell sorting was used on 686LN cells and HeLa cells with gating to exclude cells that uptake propidium iodine and to identify a population of low-EGFR expressing cells (0.20 ± 0.01% for 686LN cells and 14.85 ± 0.24% for HeLa cells). (B) Whole cell lysates were created from cells plated at 70% confluency in standard media and proteins were resolved and immunostained (α-EGFR, BD Transduction Labs). Densitometry was calculated as an average from three independent experiments. C. Spearman correlation of EGFR protein level with erlotinib IC50.

Figure 4. HNSCC cell lines are sensitive to cetuximab at therapeutic doses in vivo. Xenografts were created in nude mice from 8 HNSCC cell lines (PCI-52, UM-22A, CAL27, HN-5, 1483, OSC-19, SCC1, SCC1c8) using two million cells per inoculation. Animals were treated with 0.2mg of cetuximab 2x/week by i.p. injection using, for 7–11 weeks as indicated. Treatment was initiated upon tumor palpitation, generally 7–14 d following inoculation. Median tumor volume at the start of treatment is less than 40mm3 for all cell lines.
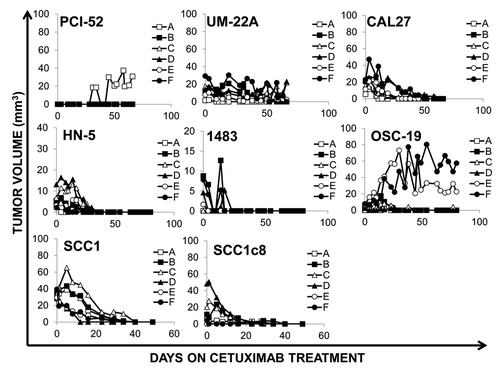
Figure 4. HNSCC cell lines are sensitive to cetuximab at therapeutic doses in vivo. Xenografts were created in nude mice from 8 HNSCC cell lines (PCI-52, UM-22A, CAL27, HN-5, 1483, OSC-19, SCC1, SCC1c8) using two million cells per inoculation. Animals were treated with 0.2mg of cetuximab 2x/week by i.p. injection using, for 7–11 weeks as indicated. Treatment was initiated upon tumor palpitation, generally 7–14 d following inoculation. Median tumor volume at the start of treatment is less than 40mm3 for all cell lines.

Figure 5. HNSCC cell lines are sensitive to cetuximab at sub-therapeutic doses in vivo. (A) Xenografts were created in nude mice from UM-22B cells using two million cells per inoculation. Treatment was initiated when tumors reached a median tumor volume of approximately 50 mm3, generally 7–14 d post inoculation. Animals received cetuximab as 0.02 mg 2 x/week by i.p. injection. After one week of treatment (dashed line) the dose was increased to 0.4mg 5x/week for two weeks and then raised to 0.2 mg 2 x/week (dashed line). (B) Xenografts were created in nude mice from CAL33 cells using two million cells per inoculation. Treatment was initiated when tumors reached a median tumor volume of approximately 300 mm3, generally 7–14 d post inoculation. Animals initially received cetuximab as 0.02mg 2x/week by i.p. injection. After one week of treatment (dashed line), the dose was increased to 0.04mg 2x/week. After another week (dashed line), the dose was increased to 0.08 mg 2 x/week. After two more weeks (dashed line) the animals began one month of treatment at the therapeutic dose, 0.2 mg 2x/week. (C) Xenografts were created in nude mice from the resistant CAL33 tumor cell line (Cal33AR1) and the parental CAL33 cell line (n = 5 tumors per cell line). Two million cells were used per inoculation, and animals were treated once median tumor volume reached 50 mm3. Animals were treated for two weeks with the therapeutic dose of cetuximab, 0.2 mg 2 x/week. No significant differences were observed in tumor volumes (p = 0.732).
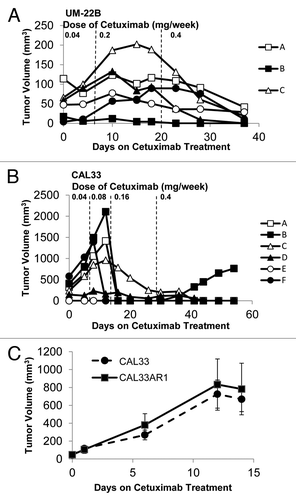
Figure 5. HNSCC cell lines are sensitive to cetuximab at sub-therapeutic doses in vivo. (A) Xenografts were created in nude mice from UM-22B cells using two million cells per inoculation. Treatment was initiated when tumors reached a median tumor volume of approximately 50 mm3, generally 7–14 d post inoculation. Animals received cetuximab as 0.02 mg 2 x/week by i.p. injection. After one week of treatment (dashed line) the dose was increased to 0.4mg 5x/week for two weeks and then raised to 0.2 mg 2 x/week (dashed line). (B) Xenografts were created in nude mice from CAL33 cells using two million cells per inoculation. Treatment was initiated when tumors reached a median tumor volume of approximately 300 mm3, generally 7–14 d post inoculation. Animals initially received cetuximab as 0.02mg 2x/week by i.p. injection. After one week of treatment (dashed line), the dose was increased to 0.04mg 2x/week. After another week (dashed line), the dose was increased to 0.08 mg 2 x/week. After two more weeks (dashed line) the animals began one month of treatment at the therapeutic dose, 0.2 mg 2x/week. (C) Xenografts were created in nude mice from the resistant CAL33 tumor cell line (Cal33AR1) and the parental CAL33 cell line (n = 5 tumors per cell line). Two million cells were used per inoculation, and animals were treated once median tumor volume reached 50 mm3. Animals were treated for two weeks with the therapeutic dose of cetuximab, 0.2 mg 2 x/week. No significant differences were observed in tumor volumes (p = 0.732).

Table 1. Summary of cetuximab dosing in HNSCC xenograft model generation. The dosing schemes for the animal studies in and are listed here

Table 2. HNSCC explant xenografts may serve as models of cetuximab resistance.

Reprints and Corporate Permissions

Please note: Selecting permissions does not provide access to the full text of the article, please see our help page How do I view content?

To request a reprint or corporate permissions for this article, please click on the relevant link below:

Academic Permissions

Please note: Selecting permissions does not provide access to the full text of the article, please see our help page How do I view content?

Obtain permissions instantly via Rightslink by clicking on the button below:

If you are unable to obtain permissions via Rightslink, please complete and submit this Permissions form. For more information, please visit our Permissions help page.