Figures & data
Figure 1. Quantification of autophagy and apoptosis activation by E2Ftr. A GLUC-based sensor to monitor autophagy or apoptosis was used. SK-MEL-2 cells were co-transfected with (A) pEAK12-Actin-LC3-dNGLUC (autophagy sensor) or (B) pEAK12-Actin-flagDEVDG2-dNGLUC (apoptosis sensor) and empty plasmid, pCMV-E2F-1 or pCMV-E2Ftr. Rapamycin (200 nM) was used as an autophagy inducer, and cisplatin (25 µM) was used as an apoptosis inducer. Supernatants were collected at different time points and analyzed for GLUC activity. Each point represents the mean of three independent experiments ± SD (bars) (*p < 0.05).
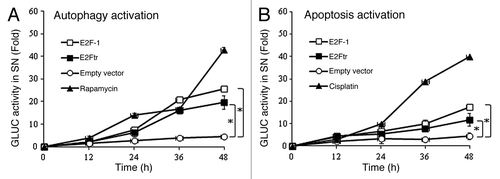
Figure 2. E2Ftr induces autophagy-specific LC3-I and LC3-II protein expression. SK-MEL-2 cells were transfected at indicated concentrations of plasmids expressing (A) E2F-1 or (B) E2Ftr. Western blot and bar graphs of E2F-1, E2Ftr or LC3-II expression after transfection. Bars represent mean ± SEM expressed as fold change of E2F-1, E2Ftr or LC3-II vs α-actin (loading control) from 3 separate experiments, (*p < 0.05) increase in the level of expression.
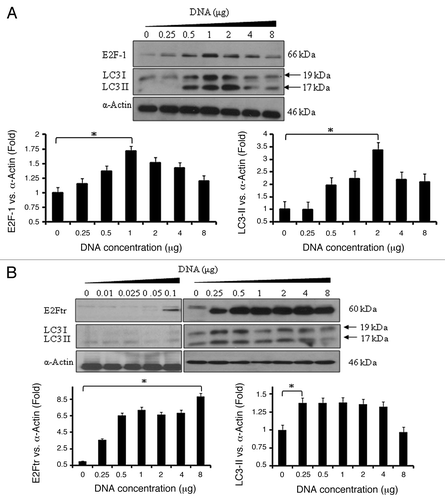
Figure 3. Autophagosome formation with GFP-LC3 incorporation is induced by E2Ftr. SK-MEL-2 cells were co-transfected with pEGFP-LC3 and empty plasmid, pCMV-E2F-1 or pCMV-E2Ftr. Incidence of punctate GFP-LC3 staining was analyzed under a fluorescence microscope. Rapamycin (200 nM) was used as the autophagy inducer. GFP diffuse expression was considered as GFP-LC3-I cytoplasmic localization. Incorporation of LC3 into the autophagosomes was depicted by GFP punctate pattern corresponding to GFP-LC3-II (arrows). chloroquine (10 µM) was used to analyze the autophagy flux. Images were obtained with Kodak MDS 290 software with the 40X objective. (B) Comparison of number of GFP dots per cell in absence or presence of chloroquine. A representative experiment is shown from three performed.
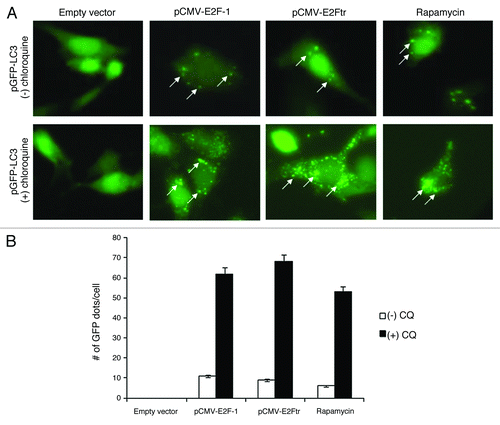
Figure 4. Effect of E2F-1 or E2Ftr expressions on Atg12-Atg5 complex or Atg5 protein levels and presence of Ad-wt in recombinant adenoviruses. (A) SK-MEL-2 cells were transfected with pCMV-E2F-1 or pCMV-E2Ftr. Expression of the Atg12-Atg5 complex and Atg5 expressions were analyzed at the indicated time points. (B) DM6 cells were infected with Ad-E2F-1 or Ad-E2Ftr at increasing MOI levels (0–100). Forty-eight hours after infection, the Atg12-Agt5 complex and Atg5 expressions were analyzed. Autophagy was associated with the appearance of a 32 kDa anti-Atg5-reactive protein. Bar graphs of Atg5 expression after transfection or infection. Bars represent mean ± SEM expressed as fold change of Atg5 vs α-actin (loading control) from 3 separate experiments, (*p < 0.05) increase in the level of expression. (C) Analysis of the possible presence of wild-type adenovirus in recombinant adenovirus vectors Ad-E2F-1, Ad-E2Ftr or Ad-EGFP. SK-MEL-2 cells were infected with Ad-wt, Ad-E2F-1, Ad-E2Ftr or Ad-EGFP at a MOI of 100. Thirty-six hours later, expression of E1A was analyzed with anti-E1A antibody. All immunoblots are representative of at least three independent experiments.
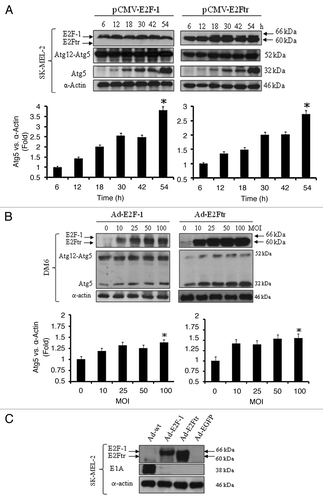
Figure 5. Analysis of the cellular morphology induced by E2Ftr. (A) SK-MEL-2 cells were either not infected (mock) or were infected with Ad-EGFP, Ad-E2F-1 or Ad-E2Ftr at a MOI of 100. Wright-Giemsa staining was performed at 24 h, and cellular morphology was analyzed under a light microscope with the 40X objective. (B) SK-MEL-2 cells, infected as described above, were subjected to transmission electron microscope (TEM) at 24 h. Magnifcations are shown for mock [magnification x7000], Ad-EGFP [magnification, x7000], Ad-E2F-1, [magnification, x9800] or Ad-E2Ftr [magnification, x7000]) (Scale bar = 200 nm). Magnification of representative double-membrane vesicles is depicted at the bottom of the figure. Similar results were observed in two additional experiments.
![Figure 5. Analysis of the cellular morphology induced by E2Ftr. (A) SK-MEL-2 cells were either not infected (mock) or were infected with Ad-EGFP, Ad-E2F-1 or Ad-E2Ftr at a MOI of 100. Wright-Giemsa staining was performed at 24 h, and cellular morphology was analyzed under a light microscope with the 40X objective. (B) SK-MEL-2 cells, infected as described above, were subjected to transmission electron microscope (TEM) at 24 h. Magnifcations are shown for mock [magnification x7000], Ad-EGFP [magnification, x7000], Ad-E2F-1, [magnification, x9800] or Ad-E2Ftr [magnification, x7000]) (Scale bar = 200 nm). Magnification of representative double-membrane vesicles is depicted at the bottom of the figure. Similar results were observed in two additional experiments.](/cms/asset/dcb0d794-d8f9-4ec5-8acd-3044a3142032/kcbt_a_10921143_f0005.gif)
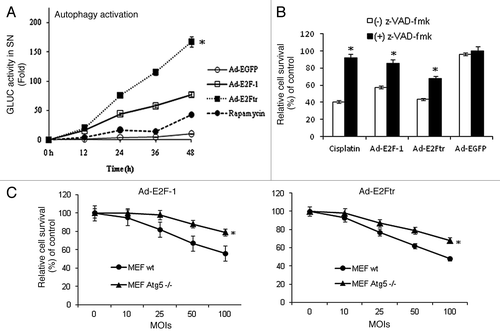
Figure 6. Autophagy activation and contribution of caspases pathway or autophagy in Ad-E2F-1 or E2Ftr-mediated killing effect. (A) SK-MEL-2 cells were transfected with pEAK12-Actin-LC3-dNGLUC followed by infection with Ad-EGFP, Ad-E2F-1 or Ad-E2Ftr at a MOI of 100 or treated with rapamycin (200 nM), which was used as autophagy inducer. Autophagy activation was monitored by Gaussia luciferase assay, as described in the Materials and Methods section. Each point represents the mean of three independent experiments ± SD (bars) (*p < 0.05). (B) DM6 cells were cultured in the absence or presence of general caspase inhibitor z-VAD-fmk at a concentration of 100 µM. Cells were then infected with Ad-E2F-1, Ad-E2Ftr or Ad-EGFP at a MOI of 100. Three days after infection, an MTT assay was performed. Each point represents the mean of three independent experiments ± SD (bars) (*p < 0.05). (C) Mouse embryonic fibroblast (MEF) wt or Atg5−/− were infected with Ad-E2F-1 or Ad-E2Ftr at increasing MOI levels. Three days after infection, an MTT assay was performed. Each point represents the mean of three independent experiments ± SD (bars) (*p < 0.05).
