937
Views
33
CrossRef citations to date
0
Altmetric
Research Paper

Oridonin in combination with imatinib exerts synergetic anti-leukemia effect in Ph+ acute lymphoblastic leukemia cells in vitro by inhibiting activation of LYN/mTOR signaling pathway

, , , , &
Pages 1244-1254 | Received 14 Oct 2011, Accepted 22 May 2012, Published online: 16 Aug 2012

Figures & data

Figure 1. Chemical structure of oridonin and cytotoxic effect of oridonin alone or in combination with imatinib on SUP-B15 cells. (A) chemical structure of oridonin.B, SUP-B15 cells were incubated with 0, 5, 7.5, 10, 12.5 μM oridonin for 1 d, 3 d and 5 d. At the end of incubation, MTT methods determined the cell survival rates. Cell viability is expressed as the percentage of cell survival compared with the control. (B) SUP-B15 cells were incubated with imatinib alone or in combination with 1 μM, 2 μM and 3 μM oridonin for 72 h. At the end of incubation, MTT methods were used to determine the cell survival rates and the IC50 of imatinib. (C) The cell viability treated with imatinib alone or in combination with indicated concentration of oridonin for 72 h. D,The IC50 of imatinib alone or in combination with indicated concentration of oridonin for 72 h. Data were from three independent experiments. *p < 0.05 was used to compare the effects of compounds.
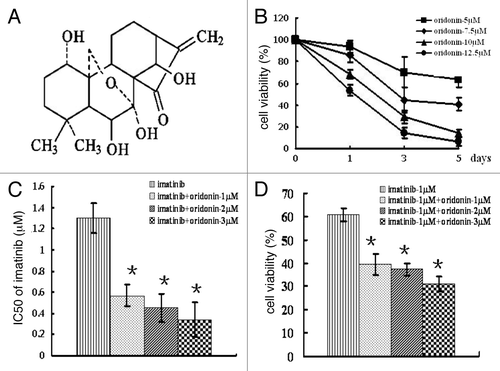
Figure 1. Chemical structure of oridonin and cytotoxic effect of oridonin alone or in combination with imatinib on SUP-B15 cells. (A) chemical structure of oridonin.B, SUP-B15 cells were incubated with 0, 5, 7.5, 10, 12.5 μM oridonin for 1 d, 3 d and 5 d. At the end of incubation, MTT methods determined the cell survival rates. Cell viability is expressed as the percentage of cell survival compared with the control. (B) SUP-B15 cells were incubated with imatinib alone or in combination with 1 μM, 2 μM and 3 μM oridonin for 72 h. At the end of incubation, MTT methods were used to determine the cell survival rates and the IC50 of imatinib. (C) The cell viability treated with imatinib alone or in combination with indicated concentration of oridonin for 72 h. D,The IC50 of imatinib alone or in combination with indicated concentration of oridonin for 72 h. Data were from three independent experiments. *p < 0.05 was used to compare the effects of compounds.

Figure 2. Oridonin and imatinib induced apoptosis in SUP-B15 cells. (A) The SUP-B15 cells were treated with indicated oridonin, imatinib, or combination for 24 h, changes in cellular morphology were examined by a light microscope. The membrane of control cells was lubricious and integrity, treatment of 3 μM oridonin, 1 μM imatinib showed little morphologic changes, but oridonin plus imatinib-treated cells showed bluffing and lobulate appearances of membrane ( × 400). (B) The cells were treated with indicated oridonin, imatinib or in combination for 24 h, then stained with hoechst 33258 fluorescent. Changes in cellular nuclei were observed under a fluorescence microscope. The nuclei of control cells were round and were homogeneously stained. Treatment of 3 μM oridonin, 1 μM imatinib showed little morphologic changes, similar to control cells, while oridonin plus imatinib-treated cells showed marked blebbing of the nuclei and apoptotic bodies ( × 200). (C) The cells were treated with indicated oridonin, imatinib or in combination for 24 h and apoptosis was examined using the AnnexinV-FITC /PI apoptosis detection kit.
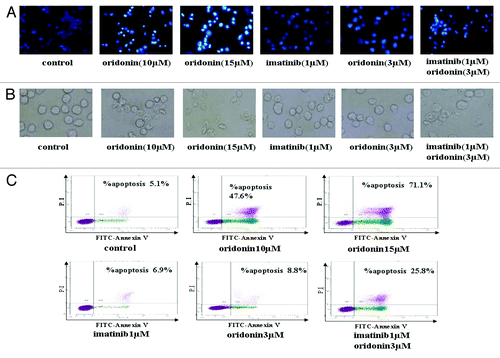
Figure 2. Oridonin and imatinib induced apoptosis in SUP-B15 cells. (A) The SUP-B15 cells were treated with indicated oridonin, imatinib, or combination for 24 h, changes in cellular morphology were examined by a light microscope. The membrane of control cells was lubricious and integrity, treatment of 3 μM oridonin, 1 μM imatinib showed little morphologic changes, but oridonin plus imatinib-treated cells showed bluffing and lobulate appearances of membrane ( × 400). (B) The cells were treated with indicated oridonin, imatinib or in combination for 24 h, then stained with hoechst 33258 fluorescent. Changes in cellular nuclei were observed under a fluorescence microscope. The nuclei of control cells were round and were homogeneously stained. Treatment of 3 μM oridonin, 1 μM imatinib showed little morphologic changes, similar to control cells, while oridonin plus imatinib-treated cells showed marked blebbing of the nuclei and apoptotic bodies ( × 200). (C) The cells were treated with indicated oridonin, imatinib or in combination for 24 h and apoptosis was examined using the AnnexinV-FITC /PI apoptosis detection kit.

Figure 3. Oridonin inhibited constitutively activation of growth-signaling pathway in SUP-B15 cells. Western blot analysis with indicated anti-phosphotyrosine, phosphoserine and phosphothreonine antibodies showed Akt/mTOR and RAF/MEK/ERK signaling pathway, Abl, STAT5 and LYN protein kinase were constitutively active in SUP-B15 cells, compared with the expression in K562 cells (A). The cells were incubated with 7.5 μM oridonin for 6, 12, 24 h or with 5, 10, 15 μM doses of oridonin for 24 h. Cells were then harvested and total proteins were extracted. Equal amounts of protein from each sample were separated on SDS-PAGE and immunoblotted with indicated antibodies, GAPDH was used as a loading control. Oridonin inhibited constitutively activation of Abl, Akt/mTOR (B and C), Raf/MEK/ERK (D and E) and STAT5,LYN (F and G) signaling pathway in time- and dose-dependent manner. The results shown were representative of two independent experiments.
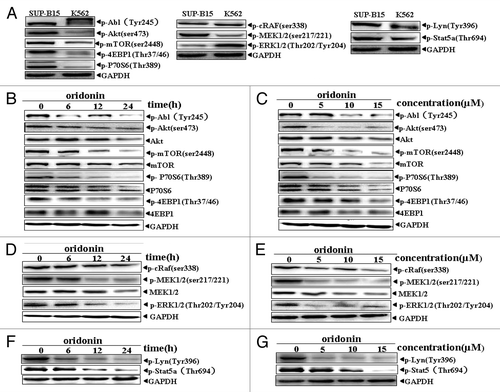
Figure 3. Oridonin inhibited constitutively activation of growth-signaling pathway in SUP-B15 cells. Western blot analysis with indicated anti-phosphotyrosine, phosphoserine and phosphothreonine antibodies showed Akt/mTOR and RAF/MEK/ERK signaling pathway, Abl, STAT5 and LYN protein kinase were constitutively active in SUP-B15 cells, compared with the expression in K562 cells (A). The cells were incubated with 7.5 μM oridonin for 6, 12, 24 h or with 5, 10, 15 μM doses of oridonin for 24 h. Cells were then harvested and total proteins were extracted. Equal amounts of protein from each sample were separated on SDS-PAGE and immunoblotted with indicated antibodies, GAPDH was used as a loading control. Oridonin inhibited constitutively activation of Abl, Akt/mTOR (B and C), Raf/MEK/ERK (D and E) and STAT5,LYN (F and G) signaling pathway in time- and dose-dependent manner. The results shown were representative of two independent experiments.

Figure 4. Effects of imatinib alone or in combination with oridonin on growth-signaling pathways in SUP-B15 cells. The SUP-B15 cells were incubated with 1μM imtinib for 6, 12, 24 h, or with 1 μM imatinib plus 3 μM oridonin for 24 h. They were then harvested and total proteins were extracted. Equal amounts of protein from each sample were separated on SDS-PAGE and immunoblotted with indicated antibodies, GAPDH was used as a loading control. Imatinib upregulated Akt/mTOR signaling pathway (A), inhibited constitutively activation of MEK, ERK signaling proteins (C) and STAT5 signaling (E) and had no significant effect on RAF and LYN signaling proteins (C,E). Oridonin overcame the upregulation of Akt/mTOR signaling pathway by imatinib. (B), Oridonin plus imatinib had no synergetic inhibitory effects on activation of MEK, ERK (D) and STAT5 (F) signaling proteins. The combination of oridonin and imatinib exerted significant inhibitory effect on activation of LYN tyrosine kinase (F). The results shown were representative of two independent experiments.
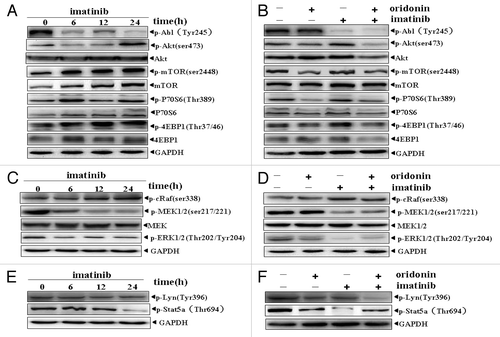
Figure 4. Effects of imatinib alone or in combination with oridonin on growth-signaling pathways in SUP-B15 cells. The SUP-B15 cells were incubated with 1μM imtinib for 6, 12, 24 h, or with 1 μM imatinib plus 3 μM oridonin for 24 h. They were then harvested and total proteins were extracted. Equal amounts of protein from each sample were separated on SDS-PAGE and immunoblotted with indicated antibodies, GAPDH was used as a loading control. Imatinib upregulated Akt/mTOR signaling pathway (A), inhibited constitutively activation of MEK, ERK signaling proteins (C) and STAT5 signaling (E) and had no significant effect on RAF and LYN signaling proteins (C,E). Oridonin overcame the upregulation of Akt/mTOR signaling pathway by imatinib. (B), Oridonin plus imatinib had no synergetic inhibitory effects on activation of MEK, ERK (D) and STAT5 (F) signaling proteins. The combination of oridonin and imatinib exerted significant inhibitory effect on activation of LYN tyrosine kinase (F). The results shown were representative of two independent experiments.

Figure 5. Oridonin modulated the expression of pro-apoptotic protein Bax and anti-apoptotic protein Bcl-2 in SUP-B15 cells. The cells were incubated with 7.5 μM oridonin for 6, 12, 24 h (A), or with 5, 10, 15 μM doses of oridonin for 24 h (B). Equal amounts of protein from each sample were separated on SDS-PAGE and immunoblotted with antibodies against Bcl2 and Bax. GAPDH was used as a loading control. The results shown were representative of two independent experiments. Oridonin upregulated the expression of pro-apoptotic protein Bax and downregulated the expression of anti-apoptotic protein Bcl-2 in SUP-B15 cells.
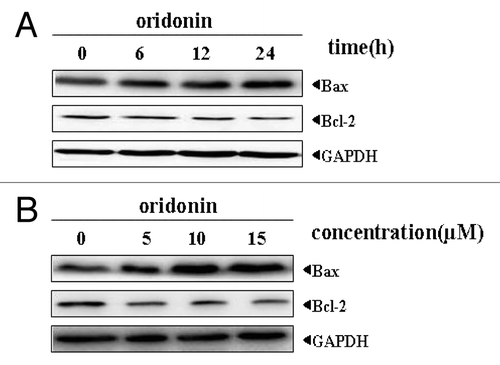
Figure 5. Oridonin modulated the expression of pro-apoptotic protein Bax and anti-apoptotic protein Bcl-2 in SUP-B15 cells. The cells were incubated with 7.5 μM oridonin for 6, 12, 24 h (A), or with 5, 10, 15 μM doses of oridonin for 24 h (B). Equal amounts of protein from each sample were separated on SDS-PAGE and immunoblotted with antibodies against Bcl2 and Bax. GAPDH was used as a loading control. The results shown were representative of two independent experiments. Oridonin upregulated the expression of pro-apoptotic protein Bax and downregulated the expression of anti-apoptotic protein Bcl-2 in SUP-B15 cells.

Figure 6. Analysis of mRNA expression of bcr-abl gene in SUP-B15 cells. The cells were treated with indicated oridonin, imatinib, or in combination for 24 h. Total RNA was isolated and RT-PCR was performed with β-actin primers as a control with the same amount of RNA. Oridonin, imatinib alone, or thier combination had no effects on the mRNA expression of bcr-abl gene in SUP-B15 cells. (A) Lane 1: control; Lane 2: oridonin 5 μM; Lane 3: oridonin 10 μM; Lane 4: oridonin 15μM; Lane 5: β-actin of conrtol; Lane 6: β-actin of oridonin 5μM; Lane 7: β-actin of oridonin 10μM. Lane 8: β-actin of oridonin 15 μM. (B) Lane 1: control; Lane 2: oridonin 3μM; Lane 3: imatinib 1μM; Lane 4: oridonin 3μM and imtinib 1μM; Lane 5: β-actin of control; Lane 6: β-actin of oridonin 3 μM; Lane 7: β-actin of imatinib 1μM; Lane 5: β-actin of oridonin 3 μM and imatinib 1 μM.
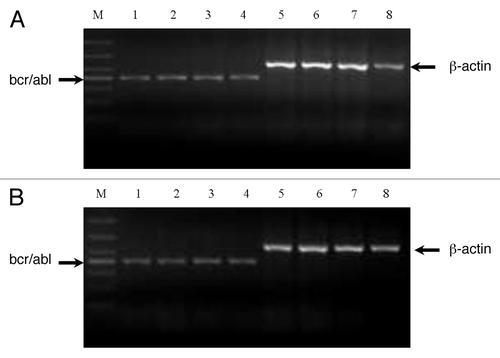
Figure 6. Analysis of mRNA expression of bcr-abl gene in SUP-B15 cells. The cells were treated with indicated oridonin, imatinib, or in combination for 24 h. Total RNA was isolated and RT-PCR was performed with β-actin primers as a control with the same amount of RNA. Oridonin, imatinib alone, or thier combination had no effects on the mRNA expression of bcr-abl gene in SUP-B15 cells. (A) Lane 1: control; Lane 2: oridonin 5 μM; Lane 3: oridonin 10 μM; Lane 4: oridonin 15μM; Lane 5: β-actin of conrtol; Lane 6: β-actin of oridonin 5μM; Lane 7: β-actin of oridonin 10μM. Lane 8: β-actin of oridonin 15 μM. (B) Lane 1: control; Lane 2: oridonin 3μM; Lane 3: imatinib 1μM; Lane 4: oridonin 3μM and imtinib 1μM; Lane 5: β-actin of control; Lane 6: β-actin of oridonin 3 μM; Lane 7: β-actin of imatinib 1μM; Lane 5: β-actin of oridonin 3 μM and imatinib 1 μM.

Figure 7. Oridonin downregulates signaling pathways in Ph+ ALL patient primary cells. The mononuclear cells from Ph+ ALL patients were treated with 5 μM oridonin,10 μM oridonin, 5 μM imatinib, or 5 μM oridonin with 5 μM imatinib for 24 h. Total proteins were extracted and equal amounts of protein from each sample were separated on SDS-PAGE and immunoblotted with indicated antibodies. GAPDH was used as a loading control. Oridonin significantly suppressed Akt/mTOR, Raf/MEK, STAT5 and LYN signaling pathways in all four clinical specimens. In patient 4 who progressed under imatinib therapy, 5 μM imatinib had little inhibitory effects on Akt/mTOR, Raf/MEK, STAT5 and LYN signaling while, 5 μM imatinib with 5 μM oridonin significantly inhibited the activation of mTOR, LYN and STAT5 signalings, but had no synergetic inhibitory effects on Raf/MEK.
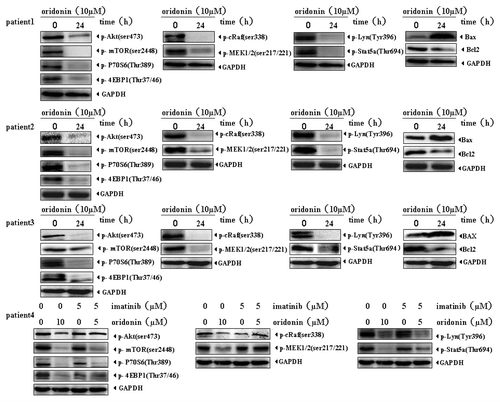
Figure 7. Oridonin downregulates signaling pathways in Ph+ ALL patient primary cells. The mononuclear cells from Ph+ ALL patients were treated with 5 μM oridonin,10 μM oridonin, 5 μM imatinib, or 5 μM oridonin with 5 μM imatinib for 24 h. Total proteins were extracted and equal amounts of protein from each sample were separated on SDS-PAGE and immunoblotted with indicated antibodies. GAPDH was used as a loading control. Oridonin significantly suppressed Akt/mTOR, Raf/MEK, STAT5 and LYN signaling pathways in all four clinical specimens. In patient 4 who progressed under imatinib therapy, 5 μM imatinib had little inhibitory effects on Akt/mTOR, Raf/MEK, STAT5 and LYN signaling while, 5 μM imatinib with 5 μM oridonin significantly inhibited the activation of mTOR, LYN and STAT5 signalings, but had no synergetic inhibitory effects on Raf/MEK.
Supplemental material

Additional material

Download Zip (3.9 MB)

Reprints and Corporate Permissions

Please note: Selecting permissions does not provide access to the full text of the article, please see our help page How do I view content?

To request a reprint or corporate permissions for this article, please click on the relevant link below:

Academic Permissions

Please note: Selecting permissions does not provide access to the full text of the article, please see our help page How do I view content?

Obtain permissions instantly via Rightslink by clicking on the button below:

If you are unable to obtain permissions via Rightslink, please complete and submit this Permissions form. For more information, please visit our Permissions help page.